Unlocking insight: the power of data visualization
Sprout Social
OCTOBER 3, 2023
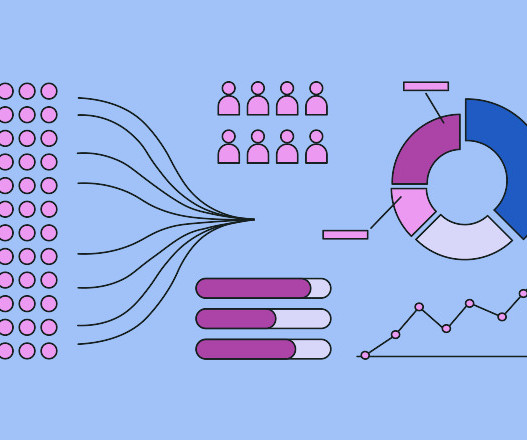
These visualizations make it easy to process and understand trends and patterns in a given data set. Quick identification of patterns and trends With data visualizations, outliers in data sets are prominently highlighted. Colors, patterns and other visual elements help people to visualize the story that your data is trying to tell.


Let's personalize your content