Unlocking insight: the power of data visualization
Sprout Social
OCTOBER 3, 2023
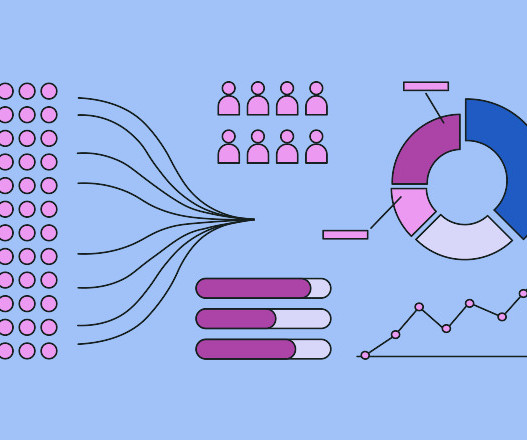
Graphs – Diagram presenting data with lines, curves, areas, points or segments. If you hover over each country on the map, you get an overview of its CPI score and how it has changed since the last year. Charts – Tabular and graphical presentation of data, usually along two axes. Best for presenting categorical data.


Let's personalize your content