Do you want to learn how to create and use monthly Facebook analytics reports? If not, you’re not alone!
We don’t have to tell you that Facebook is still one of the most popular social media sites in the world. There are over 2.93 billion active users, and statistics show that this number is growing.
Regularly tracking and reviewing your Facebook analytic data is an excellent way to understand how your marketing strategies are performing and what you need to do to optimize them for even better results.
When used correctly, this data can help you build rapport with subscribers, increase website traffic, and enhance brand awareness.
You’ll be happy to know that creating a monthly Facebook analytics report doesn’t have to be complicated оr time-consuming. In fact, with the right tools, you can have an insightful report ready in just a few minutes.
Today, we’ll show you why monthly Facebook reporting is important for your business, the key metrics you should be monitoring, and how to create a monthly Facebook analytics report with our free template.
Let’s begin!
Table of Contents
Why track your Facebook analytics?
If you’re not already analyzing your Facebook analytics, you’re missing out on a goldmine оf opportunities. Tracking this information each month will help you understand what’s working, what’s not, how to improve, and much more.
Here’s a quick breakdown оf four crucial reasons you should start tracking your analytics today.
1. Understand your target audience
Analytics data in your Facebook reports will help you better understand your target audience. People show their interest in how they browse and engage with content online. The average person spends around 2.5 hours оn social media sites every day, so it’s a good idea to examine their demographics and interests so you can continue producing interesting, relevant posts.
The more you know about your target audience, the easier it is to build rapport and show them why your product оr service is worth their time.
2. Track engagement
All businesses need engagement оn social media to thrive. Tracking key metrics like likes, shares, and comments, you can see how your audience feels about specific pieces оf content. This data will help you identify what types оf posts are most engaging and adjust your strategy accordingly.
For example, if you find that your audience is more likely to engage with videos than traditional text-only posts, you know that it’s a good idea to make more video content. Tracking engagement also helps you measure the success of your overall Facebook strategy. A decline in engagement over time may be a sign that you need to freshen things up and rethink your strategy.
3. Discover the best times to post
Your Facebook analytics can also help you determine the best times to post. We like to look at our Facebook insights so we can see which days оf the week and times оf day our posts generate the most engagement.
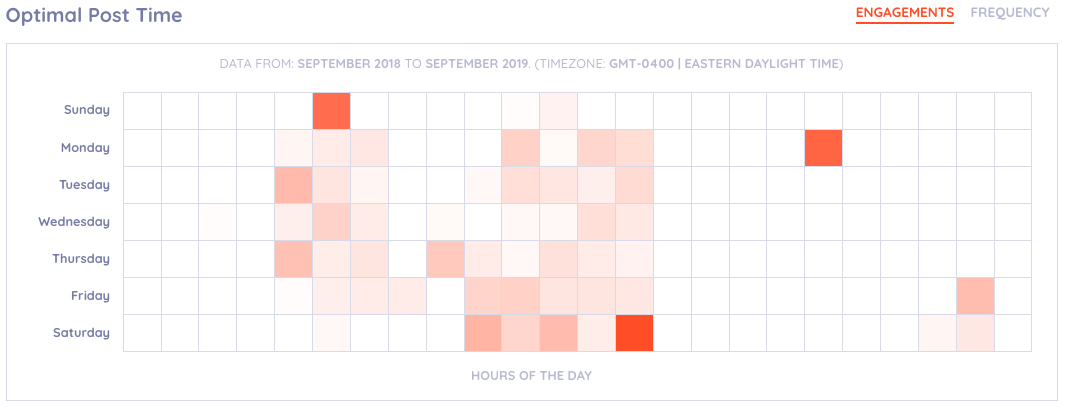
Then, we can schedule posts in advance so that they reach our audience when they are most likely to see them. And if more people see our content, that means more opportunities to boost awareness and engagement.
4. Track paid ads
Facebook ads can be a powerful tool for reaching new audiences and promoting your business. However, it’s important to track your ad performance to ensure that you’re getting the most out of your investment. By tracking metrics like impressions, clicks, and conversions, you can see how effective your ads are and make adjustments as needed.
What Facebook metrics should you be tracking?
- Reach: Your reach is the total number оf unique people who see your posts. This metric is important because it helps you understand your visibility. A low reach means not a whole lot of people are discovering your content, which will make it hard to grow.
- Total engagement rate: You could look at isolated instances оf engagement like clicks, shares, and comments if you want to see specifically how people engage with your content. But your total engagement rate represents how many people decided to interact with your content versus how many people saw it. Use this metric to make sure your content resonates with the right audience. A low total engagement rate signifies that people are not interested in what you’re sharing, which can become a serious problem.
- Click-through rate (CTR): CTR measures the percentage оf users who clicked оn a link in your post. It helps you understand how effectively your content is driving traffic to your website оr landing page, which is essential when you consider that 74% оf social media referral traffic comes from Facebook. A high CTR indicates that your content is not only engaging but also persuasive, effectively guiding users toward your desired action. This іs
- Audience demographics: Understanding your audience demographics, such as age, gender, location, and interests, is crucial for tailoring your content to their specific needs and preferences. Analyzing these demographics helps you identify your target audience segments and refine your targeting strategies for maximum impact.
- Brand mentions: Brand mentions let you track the number оf times your brand name оr social media handle is mentioned in Facebook posts, comments, and discussions. You can use these opportunities to jump in and engage with people who like your brand. Since 59% of people turn to social media when they want to buy a product, this can be extremely helpful.
- Paid ad performance: If you use paid ads, monitoring key metrics like impressions, clicks, conversions, and cost-per-click (CPC) is crucial to your success. It’s nearly impossible to optimize your paid ads if you don’t know exactly how people are responding to your ads.
How to create a Facebook analytics report
Before we give you the free template, let’s go over step-by-step how to create a monthly Facebook analytics report:
Step 1: Establish goals and KPIs
The first thing to do before creating your report is establish your Facebook goals and key performance indicators (KPIs). Think carefully about what you’d like to achieve from your Facebook marketing strategy and come up with manageable numbers around each goal.
For example, if your goal is to grow your presence, one thing you might want to track is your follower count and get 100 new followers each month.
Step 2: Collect Facebook analytics data
Now that you know what you want to achieve, it’s time to start collecting data. There are three main ways to do this: Facebook Insights, third-party analytics tools, and manual tracking.
We suggest using a Facebook analytics tool to gather your data. This will make it easier to gather vital insights on things like general performance, engagement, and growth over time.
Step 3: Analyze the numbers
The next step is to analyze the numbers. Your goal is to figure out where you’re excelling and what you can do better. If you know which type of posts do well and when to maximize your engagement, you can continue growing your Facebook account at a steady pace.
Step 4: Create a monthly report
Once you’ve collected and analyzed your Facebook data, it’s time to create a monthly report. You’ll want to make sure key metrics are tracked and reported here so you and the rest of your team can reference them during social media brainstorming sessions.
Step 5: Evaluate and adjust
The final step of the process involves comparing your monthly reports to the goals and KPIs you established at the beginning of this process. It’s a good idea to adjust your strategy based on how you’re doing.
For example, if you consistently exceed your 100 follower count goal, try setting a higher goal of 150 for the following month. These evaluations and adjustments will help you fine-tune your Facebook marketing strategy.
How to use our free monthly Facebook analytics report template
If you’re here for the free Facebook analytic template, look no further! We’ve put together a great free template you can use to make life easier:
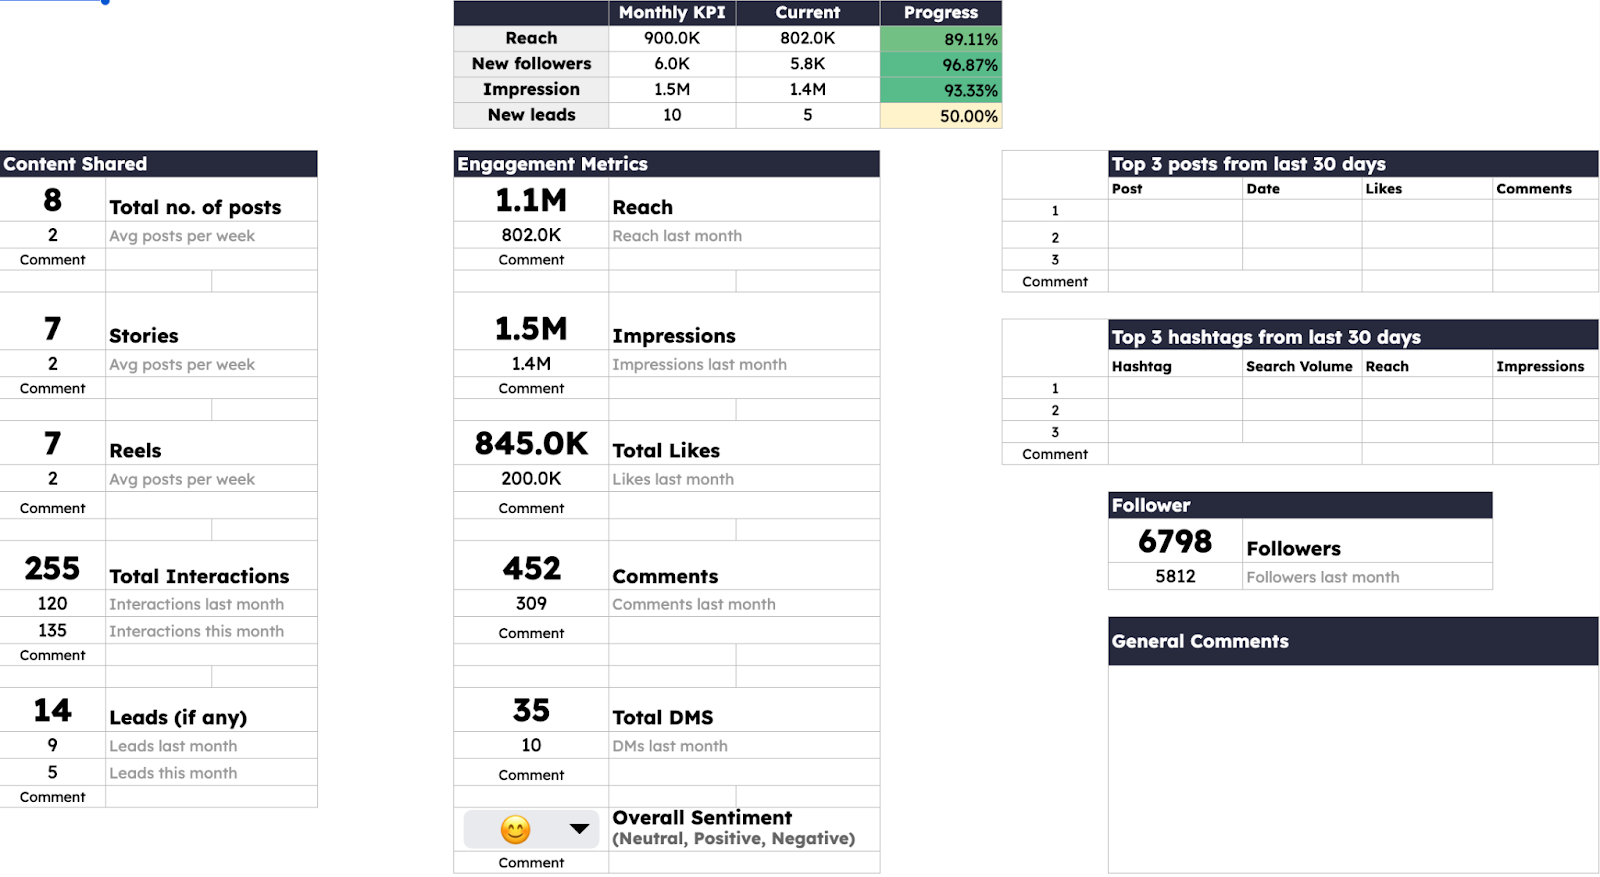
Here’s how to start using it today:
First, open our free monthly Facebook analytics report template. In just a few clicks, you can customize it to meet your specific needs. If you’d like to make one from scratch, that’s also an option.
The next step is to plug in your Facebook metrics. Don’t forget to include the dates so you know the timeframe you’re tracking.
Look over the data and try to find any noticeable patterns or trends. In many cases, these trends can help you figure out which part of your strategy is working and where you can improve.
Finally, use the data to make an actionable plan. Facebook and social media marketing, in general, rely on concrete information. If you understand how people are engaging with your account, you can come up with posts and other types of content that meet their needs and keep them invested in your brand.
Bonus: Benefits of using Keyhole to track your Facebook Analytics
If you’re not using a third-party tool to create your monthly Facebook analytics reports, you could benefit from Keyhole! Our advanced profile & competitive analysis tool allows you to easily measure and grow all of your social media accounts in one place.
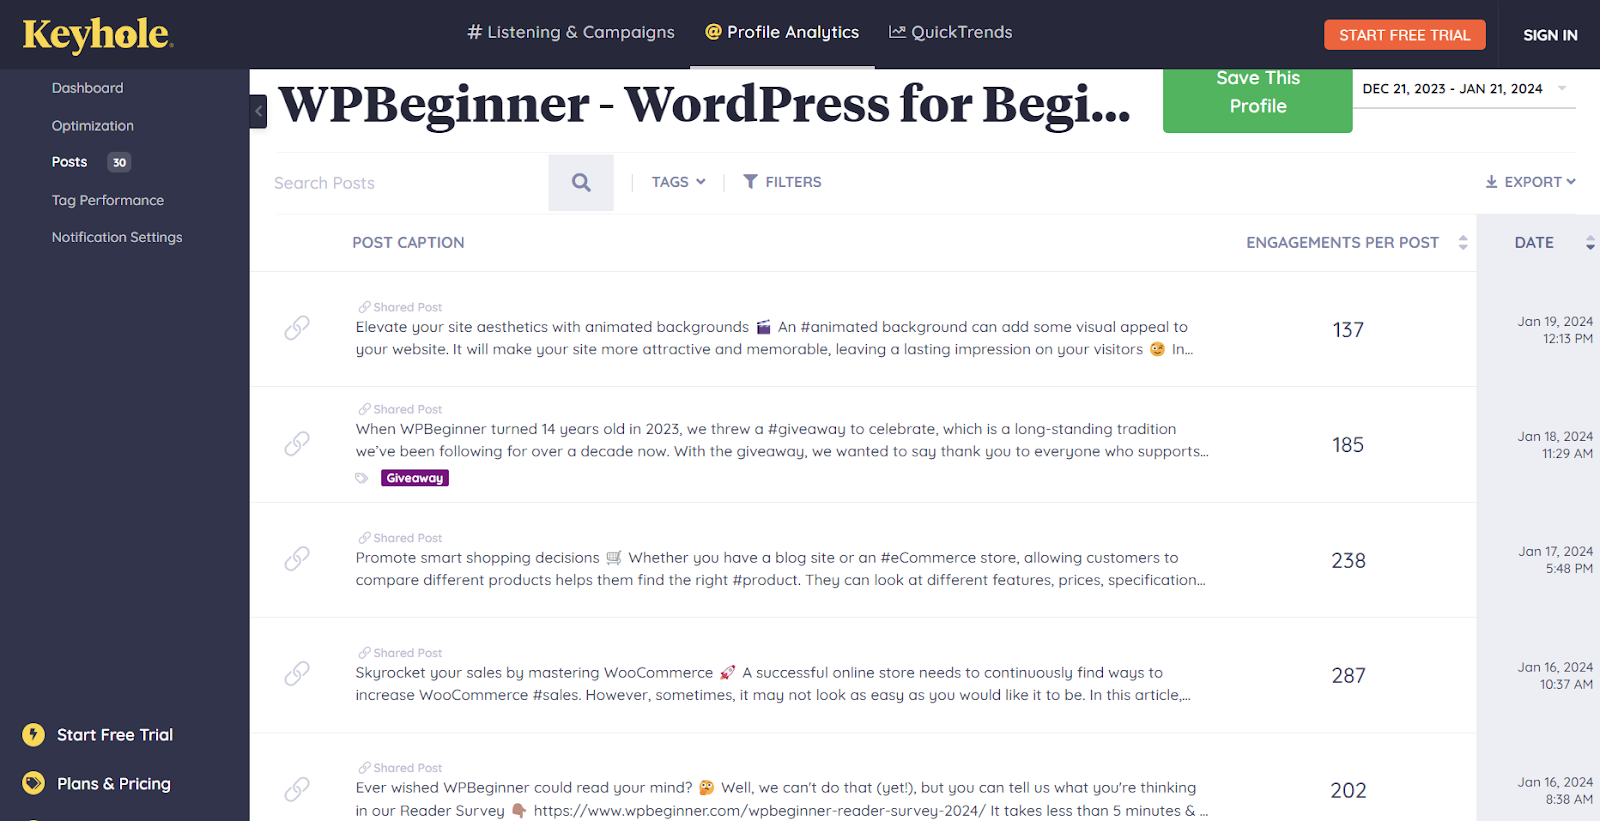
With a few clicks, you can input your data from Facebook and other social sites so you can figure out which posts and content perform the best, which can help you replicate your success.
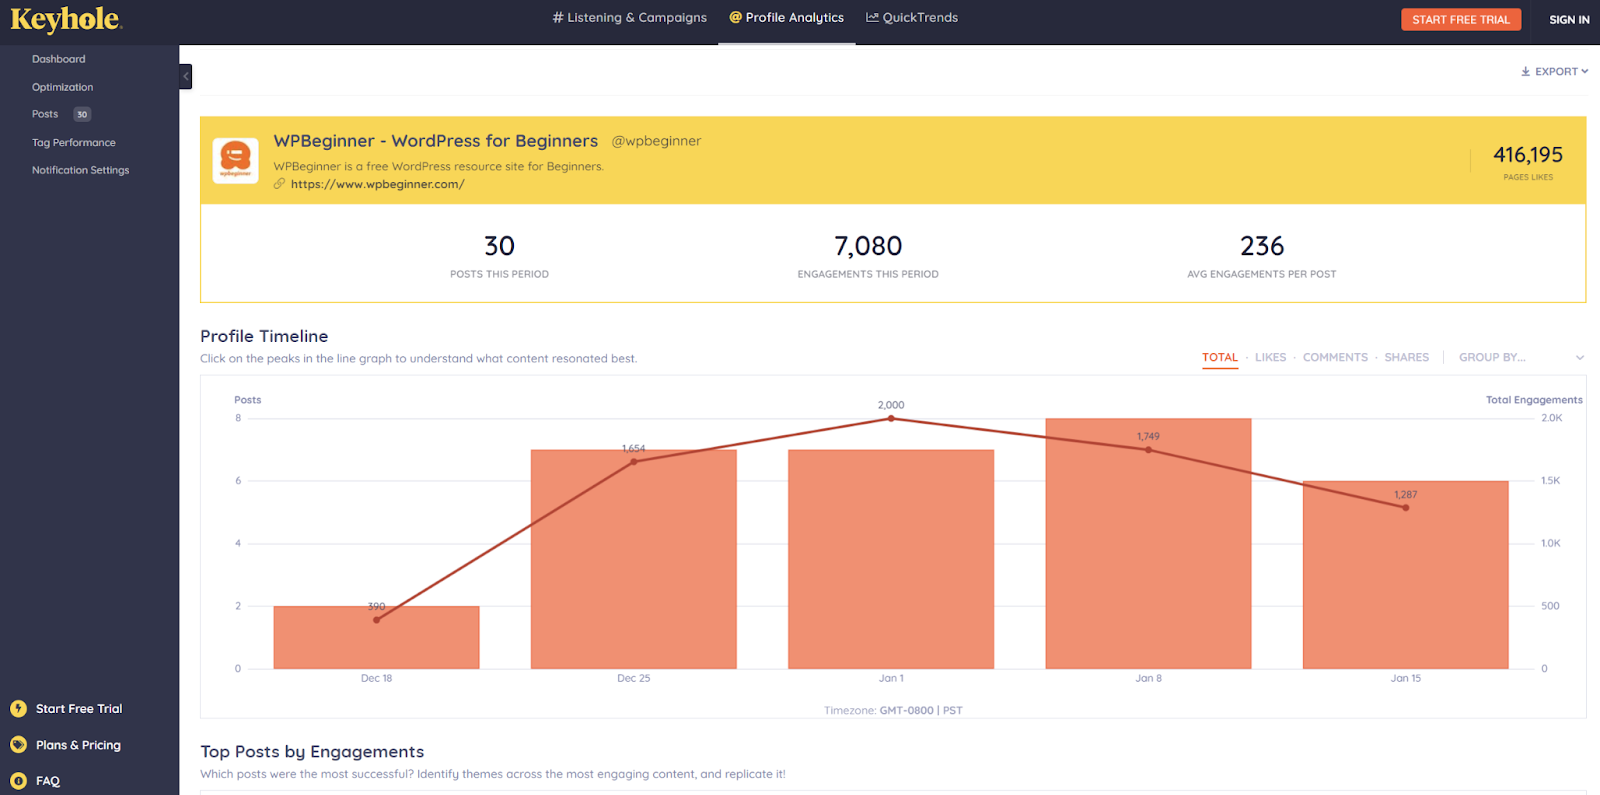
You can also optimize your social presence based on actionable data. Our reporting will help you figure out the best time to post so you can maximize clicks and engagement.
And if you’re interested in tracking your competitors, we have something for that! Our competitor analysis tool will help you access any and every competitor in one easy-to-use dashboard. Keyhole also makes it easy to see which posts are doing well so you can start brainstorming for your next social media campaign.
If you’re ready to experience these benefits and more, we have you covered!
Conclusion
Creating a monthly Facebook analytics report shouldn’t be intimidating or time-consuming. The information packed into these reports can help you track your performance and adjust based on engagement, conversions, and much more.
With a tool like Keyhole, you can quickly and easily create Facebook reports with minimal effort and maximum benefit. Once you have these reports, it’s much easier to make the right choices for your business.
We are confident that with patience and persistence, you can exceed your Facebook marketing goals and take your brand to new heights.
Author Bio

Syed Balkhi is the founder of WPBeginner, the largest free WordPress resource site. With over 10 years of experience, he’s the leading WordPress expert in the industry. You can learn more about Syed and his portfolio of companies by following him on his social media networks.
Related Articles
Facebook Analytics Guide 2024: How To Analyze & Use Your FB Data
The Ultimate Guide To Facebook Marketing For Budding Brands
Frequently Asked Questions
1. What are the benefits of tracking Facebook Analytics reports?
You can boost brand awareness, engagement, clicks to your website as well as optimize content and campaigns for your target audience.
2. What metrics should I include in my monthly Facebook analytics reports?
You should track metrics like your reach, mentions, engagement rates, audience demographics, and top posts.
3. Is it possible to create monthly Facebook analytics reports without using third-party tools?
Yes, it’s possible to manually collect and sort through your analytics. However, this is time consuming and not always accurate.
4. How can I start improving my Facebook account’s performance?
One of the best ways to get better results from Facebook is to track and analyze your data. Figure out what you’re doing right, and where you can improve. Use this information to slowly evolve your strategy.