One of advertisers’ biggest requests is Meta ads benchmarking information on what to expect for performance. Are you getting good results? Great results? Terrible results?
Of course, you can’t just compare your results to all other advertisers. Factors like country, objective, and industry all matter. You need better context.
You might not know this, but such information is available.
Let’s talk about it…
Ads Benchmarking
Ads Benchmarking is a resource found within Ads Reporting to show advertisers how they are performing compared to their peers, highlighting both outperforming and underperforming ad setsAn ad set is a Facebook ads grouping where settings like targeting, scheduling, optimization, and placement are determined. More
To find similar ad sets, Meta uses machine learning and compares you to other ad sets based on industry, size, campaign objectiveWhen you create a campaign, one of the first things you'll do is select an objective. The campaign objective is your ultimate goal. Your selection will impact options, including optimization and delivery. Options include Awareness, Traffic, Engagement, Leads, App Promotion, and Sales. More, target region, and more.
Where Is It?
Go to your Ads Reporting…
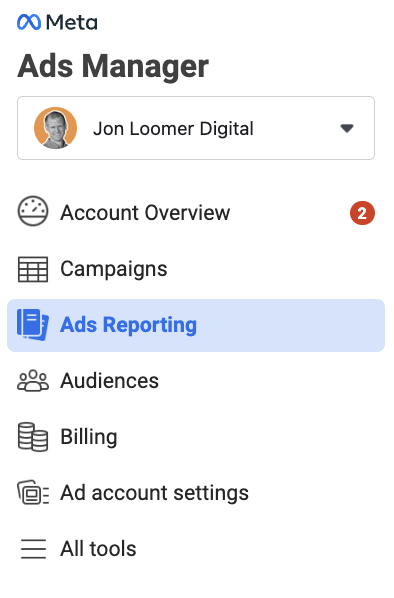
This is not within the main Ads Manager interface, so you’ll need to do some digging.
Next, click on Personalized Insights.
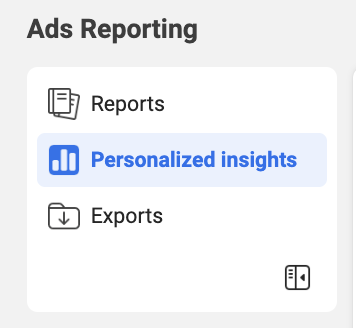
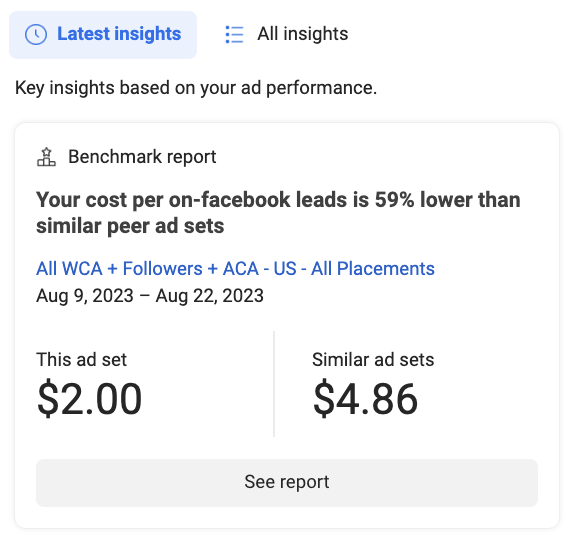
You should see the highlights of at least one Benchmark Report.
Click “See Report.”
The Benchmark Report
The full Benchmark Report looks like this…
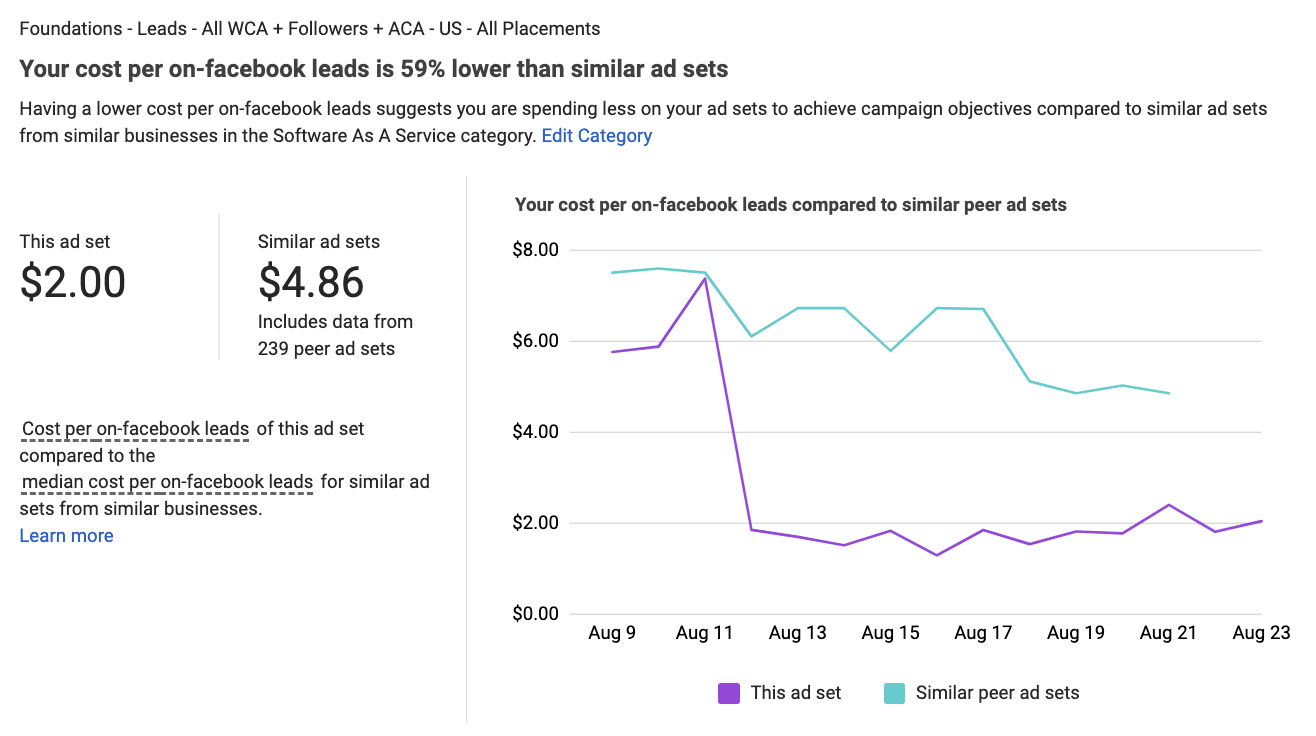
At the top is an overview of the ad set that is featured and how it performed.
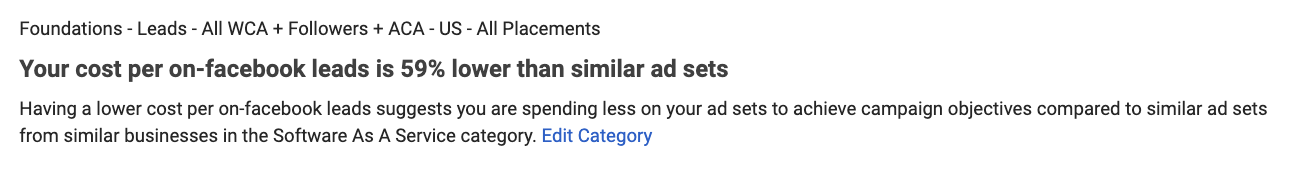
In this example, the ad set’s Cost Per on-Facebook Lead is 59% lower than “similar” ad sets. How are ad sets compared to determine what is similar? Here you go…
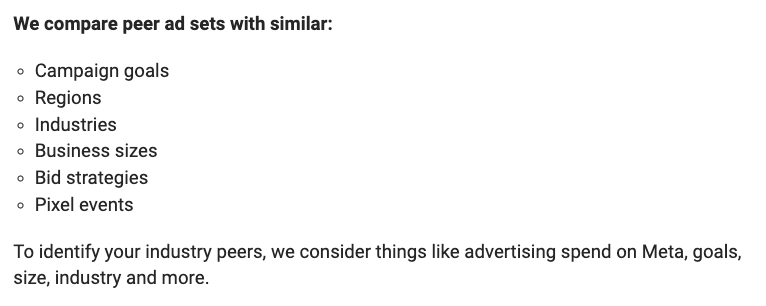
This ad set was compared to other ad sets based on:
- CampaignThe campaign is the foundation of your Facebook ad. This is where you'll set an advertising objective, which defines what you want your ad to achieve. More goals (Leads)
- Regions (US)
- Industries (Software as a Service)
- Business Sizes (?)
- Bid Strategies (Highest Volume)
- Pixel EventsPixel events allow you to track specific actions on your website that can be used for reporting, targeting, and optimization. More (N/A in this case)
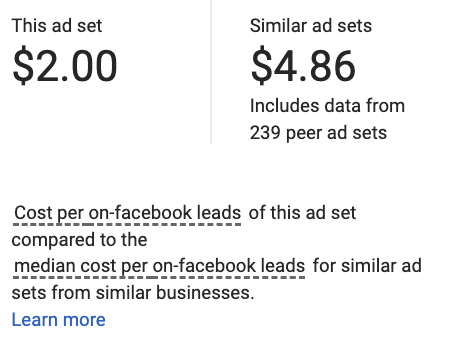
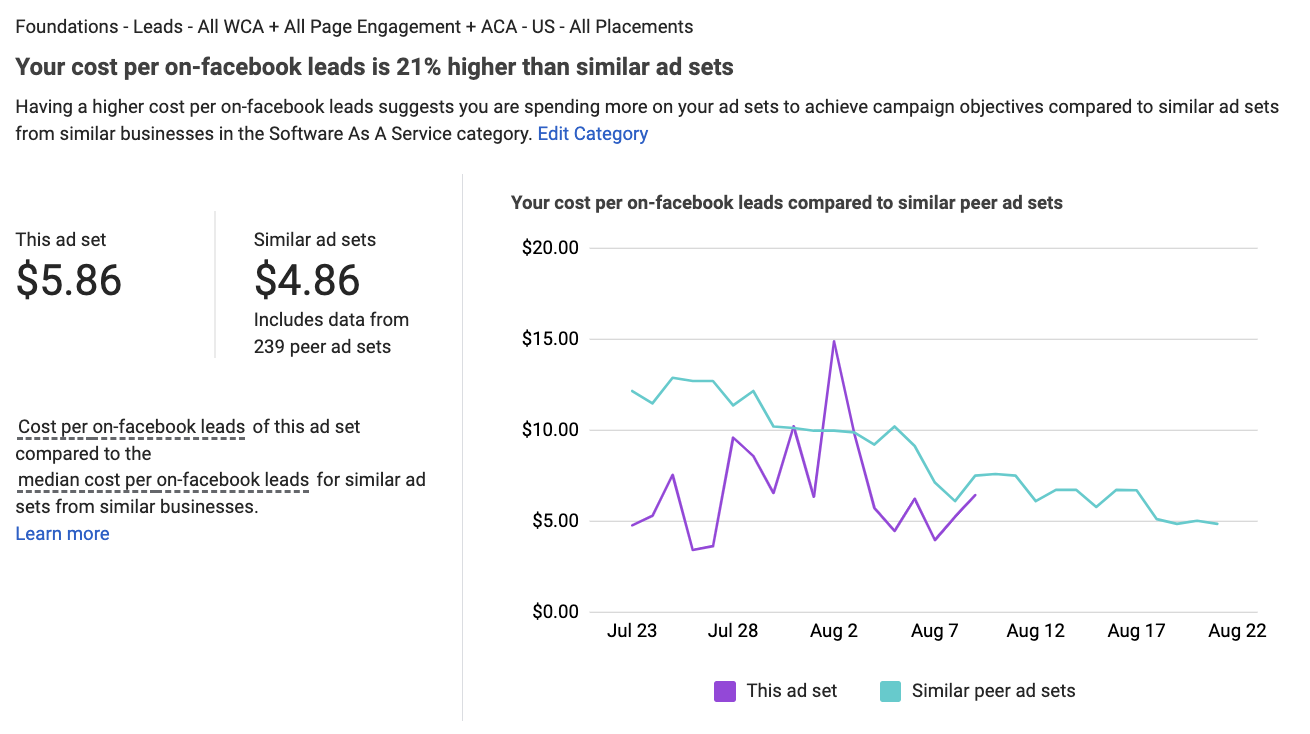
On the left, we see that the Cost Per on-Facebook Lead for this ad set is $2.00 while it’s $4.86 for similar ad sets. This includes data from 239 “peer ad sets.”
We also get to see how this ad set and the peer ad sets performed on the same days over time.
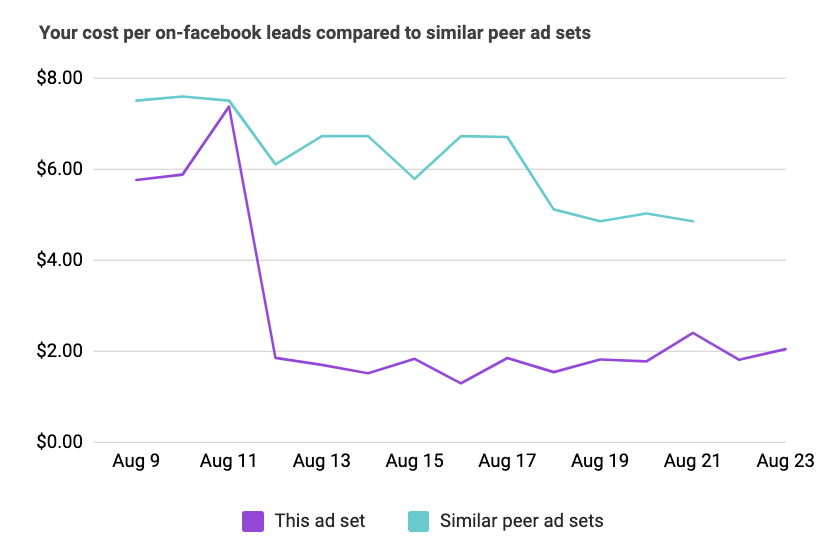
This is helpful in case there has been a common increase or decrease in costs, like seasonal competition.
Edit Industry
In this example, you may have noticed that my peers are based on the Software as a Service industry. I’m not sure how or where that was determined, but it can be edited.
At the top of this report, there’s a link to “Edit Category.”
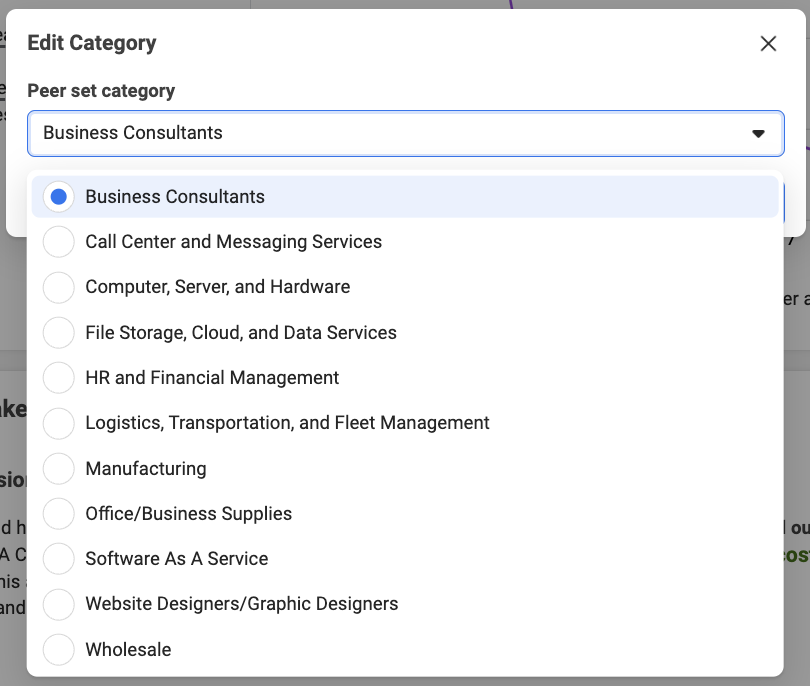
The funny thing is that none of these are particularly great. It’s strange that these are the only options. If I were to make a change, I’d go with Consultants. When I did, the report changed with it.
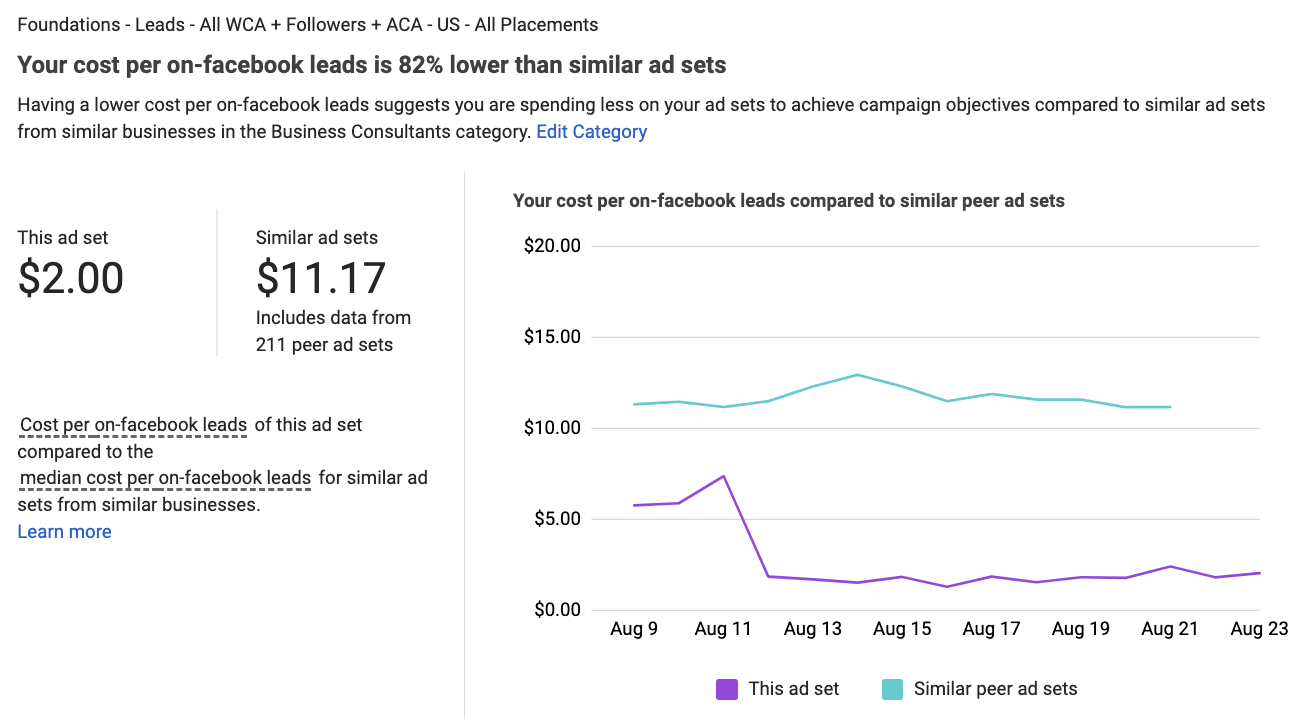
Yikes! That Cost Per Lead is high for the Business Consultants industry.
Not All Reports Are Good
If you’re wondering, you’ll also see reports that aren’t in your favor. Here’s an example…
Actions You Can Take
There’s also an Actions You Can Take section, presumably to improve your results. But this feels very incomplete.
First, it doesn’t seem to apply to any Benchmark Report in particular.
Second, the action I’m told to take is to set up the Conversions APIConversions API provides a direct connection between your conversion results and Meta to be used for ad set optimization and reporting. Examples include both web and offline events. By using a Conversions API, you can send Meta a more complete picture of conversion activity to help improve your results. More.
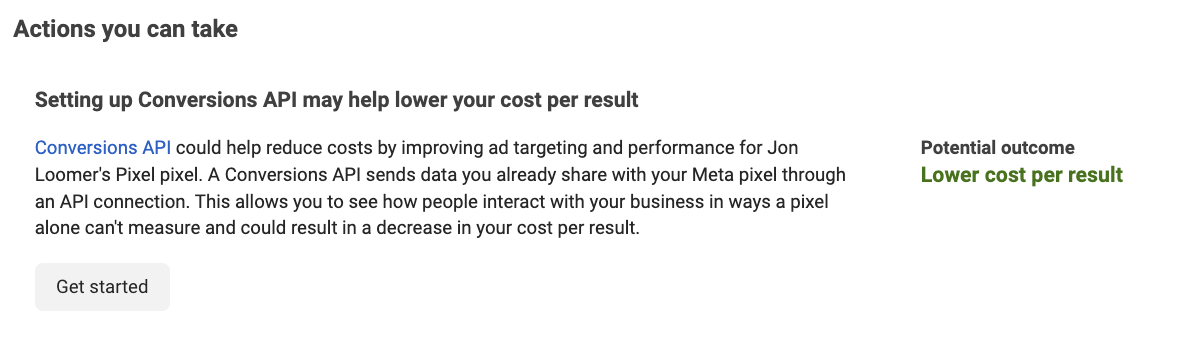
The problem? Meta knows darn well that I have the ConversionsA conversion is counted whenever a website visitor performs an action that fires a standard event, custom event, or custom conversion. Examples of conversions include purchases, leads, content views, add to cart, and registrations. More API set up.
So, this feels very generic and unfinished. Hopefully, this portion will be improved to be customized to specific reports to offer helpful recommendations that actually make sense.
Watch Video
I recorded a video about this, too…
Your Turn
Do you use Ads Benchmarking? What do you think?
Let me know in the comments below!