It’s a common problem. As Meta advertisers, we’re constantly on a quest for good results. But there’s a situation we’ve all encountered that will make any great advertiser uneasy. The results are good. Really good. But are they too good to be true?
There must be something wrong. I created a great campaignThe campaign is the foundation of your Facebook ad. This is where you'll set an advertising objective, which defines what you want your ad to achieve. More, and I’m proud of it, but this just doesn’t seem possible.
Unfortunately, sometimes your instinct is proven correct. Those results were, indeed, too good to be true. There was an explanation that lowers your excitement about the perceived accomplishment.
Learning that Ads Manager results are too good to be true usually comes down to one of the following:
1. Over Reporting: This tends to be because you set up something wrong that leads to double or over counting.
2. Low Quality: Typically related to low-quality leads or engagement of some kind.
3. Mistaken Interpretation: You took the results at face value, but there are layers to them that help explain what you’re getting.
On one hand, I understand how this is an uncomfortable situation. You feel really good about yourself. Maybe a client feels great about the results. It may be a matter of “ignorance is bliss.” But, eventually, you’ll need to face reality.
If you’re ever in the situation where you fear your Ads Manager results are too good to be true, follow these steps to check for common explanations…
1. Real-World Validation
This is the most obvious example of Ads Manager results that are too good to be true. If Ads Manager is reporting more results than happened, regardless of the source, that’s a problem.
Understand that this isn’t about validating that a secondary source confirms the number of conversionsA conversion is counted whenever a website visitor performs an action that fires a standard event, custom event, or custom conversion. Examples of conversions include purchases, leads, content views, add to cart, and registrations. More that came from your ads. There is a long list of reasons why Ads Manager can report results and other sources won’t credit your ads. That’s not necessarily a problem.
The issue would be that Ads Manager says you have 100 new purchases and only 40 happened — total, regardless of the perceived source. That’s a sign that something is wrong with your reporting.
Keep in mind, however, that how Ads Manager reports your results could also throw off your ability to match them up with real-world sales. Meta reports conversions based on the date of impression, not the date of conversion. So, the following could happen…
Ads Manager: 10 Purchases on Monday and no purchases on Tuesday through Friday.
Real World: No purchases on Monday, 5 purchases on Thursday and 5 purchases on Friday.
The default attribution setting is 7-day click and 1-day view, so an ad can get credit for a conversion that happened seven days after clicking. But the date of that conversion will be the date of the impression.
That’s a bit in the weeds, but keep it in mind when lining up Ads Manager with real-world results.
2. Compare Attribution SettingsCompare Attribution Settings is a feature within Ads Manager reporting that allows you to view how many conversions happened within each attribution window, regardless of the Attribution Setting used for optimization. For example, columns can be added to your report for 28-day click, 7-day click, 1-day click, and 1-day view to see how conversions are distributed across them. More
This is how to uncover one of the most common and easiest explanations for results that seem too good to be true.
The problem isn’t that Ads Manager results results don’t match up with real-world results. You just don’t believe that your ads have been responsible for the number that Ads Manager reports.
Sometimes, it’s a matter of understanding context and not taking your results at face value. The conversions may have happened (as defined by the attribution settingAttribution is how Meta gives credit to an ad for a conversion. Your Attribution Setting determines how your ad will be delivered and the reporting attribution window. The default Attribution Setting is 7-day click and 1-day view, which means that anyone who converts within 7 days of clicking or 1 day of viewing your ad will be counted as a conversion. More), but not all of them may be considered equally valuable. Let’s use a couple of examples.
Purchases.
You have a campaign that has generated 38 purchases. Let’s compare attribution settings to see how those purchases are broken down. Select every attribution setting.

You’ll then get separate columns for each attribution setting.

There’s a lot happening here…
1. First, 14 of the 38 purchases are 1-day view. It’s not that view-through is completely worthless (especially for purchases), but they are less valuable than a 1-day click. Especially if you emailed many of the same people you were targeting, it’s possible that some of these 14 were simply people who had an impression they didn’t see and converted later that day due to the email.
2. Second, 13 of the purchases happened with a day of clicking. These are the results that you may have the most confidence in because it started with a click and the purchase completed either immediately or within 24 hours.
3. Another 11 (24 minus 13) happened from days 2 to 7 after clicking. I have no issue with these. But someone might make the argument that it’s possible something else was responsible for the eventual purchase.
4. Another 10 (34 minus 24) conversions weren’t even included in the default reporting! These happened between days 8 and 28 after clicking. Meta knows that these people clicked and that they eventually converted. Once again, I have no issues with counting these. But you may place less value on them than 1-day click or 7-day click.
It’s not that 38 (or 48) purchases didn’t happen. But you have differing levels of confidence that your ad is fully responsible.
Registrations and other lighter-touch conversions.
I dug up a campaign that I ran that promoted a blog post, and it led to 257 registrations. Seems crazy! Or maybe too good to be true. Let’s compare attribution settings…

You may not be surprised that this was a remarketing campaign. Of the 257 reported registrations, 142 (55%!) were 1-day view. While you can make the argument for view-through conversions when running a purchases campaign, you can’t here.
Why? Because 142 people didn’t click my ad to read a blog post. But they eventually registered for something within a day. It’s an enormous stretch to suggest that those 142 people were so inspired by the mere appearance of my ad that they googled or went directly to my website to register for something different.
More than likely, this was a case of targeting the same people who were visiting my website anyway.
You can make the argument that the 72 people who clicked this ad to a blog post eventually registered for something. It could have been my newsletter. I have popups and cross promotions. I consider those legit.
But beyond that, I wouldn’t give this ad any credit for the 115 7-day or 104 8-28 day click registrations. Maybe my ads resulted in 72 registrations, but anything beyond that is a stretch.
You may also be interested to know that this ad was also credited with 17 total purchases. But 8 of them were 1-day view (worthless in this situation) and none of them were 1-day click.
Too good to be true? Confirmed.
3. Check for Duplication or Overcounting of Events
It’s possible that the reporting in Ads Manager is completely legit. Meta’s reporting conversions credited to your ads. But that relies on you properly defining these conversions.
Here are some things to check…
1. Event Deduplication. Are you passing events via both the Meta pixel and Conversions API? You should be. But, hopefully those events are properly deduplicated. If they aren’t, Meta may count each conversion twice — once from the pixel and once from the API.
If you ever spend any time in Events Manager, it should be obvious if deduplication is an issue. Meta should have alerts all over the place. Unfortunately (or luckily), I don’t have an example of that to show you.
Go to Data Sources and select your pixel. Then expand an event you want to check for deduplication that is working with both the pixel and API. Click “View Details.”

Then click “Event Deduplication” and you will get a review of whether there are any issues.

2. Check Event Location. Well, there was a time when this was possible. Within the same View Details screen from the Event Overview tab, go to Event BreakdownBreakdown is a way to get insights into your ad performance related to time, delivery, action, or dynamic creative element. More and select URLs.

This should technically list specific URLs where these events are happening. For whatever reason, I’m only seeing domains. I’m still including this step because this appears to be a bug and hopefully it will be fixed.
Ideally, you’ll be able to easily see where your events are happening. You may fire purchase and registration events on the confirmation pages after that action is completed. But this may help you spot a problem if those events are happening on other locations that may lead to overcounting — like the landing page.
3. Test Your Events. Go to the Test Events tab in Events Manager.

Select the channel (probably website) and select whether you’re confirming server or website events.

Assuming you haven’t seen a weird spike in one or the other, let’s use website events as the example.
You will want to go through each step of a conversion. Don’t simply test the confirmation page. Do your best to mimic the user experience.
Paste the URL for the landing page (or whatever starting point you want to use) and click “Open Website.”

The events will dynamically appear within this section of Events Manager as you walk through a conversion on your website.

Look for duplicate events or cases where the events are firing before they should be.
If you spot a problem, of course, you’ll need to fix it. That would require using whatever tool you currently use to create and add events to your website.
4. Check the Assigned Value
A common source of Ads Manager results that are too good to be true is an inflated conversion value that drives the ROAS and Conversion Value columns.

Here are a couple of specific steps to take…
1. Compare Attribution Settings. You would have done this before when checking the total number of conversions and cost per conversion, but it applies to ROAS and conversion values, too.
That ROAS and Conversion Value in the screen shot above? That’s too good to be true…

This was another example of promoting a blog post, but it “led to” purchases. The entire $10,548 in conversion value came from view-through conversions. This is also what drove the ROAS.
Once again, view-through conversions aren’t necessarily a problem. But they have to make sense. If you’re promoting a blog post and people end up buying something unrelated without even clicking the blog post link, you can assume your ad had nothing to do with those purchases.
2. Confirm Assigned Value. The ROAS and conversion value columns are dependent on how you’ve defined the value of these conversions. It may be dynamic or you may have added values manually with event code and parameters.
First, don’t assume that the product purchased is what you were promoting in the ad. As outlined multiple times here, that’s not always the case.
Second, do the math on the product you were promoting. Is the number of purchases multiplied by purchase value in line?
And finally, add custom conversions for specific products. There was a time when Ads Manager would display all of the conversions that happened when hovering over the Results column, but that no longer seems to be the case. So, now it requires that you would have set up custom conversionsCustom conversions let you create rules for events or URLs so that you can better track and optimize for specific actions with Facebook ads. More for your products so that you can view how many of them were purchased.
If a value is off, you’ll need to update it wherever it is set.
5. Double Check a Second Tracking Source
Now, let’s be careful about this one. It’s easy to get carried away with discrepancies.
It’s helpful if you use UTM parameters with your ad links so that you can double check results in GA4 or another reporting software. This is so that you can spot big problems. But ignore any somewhat minor differences.
Ads Manager and GA4 will not report the same. I’ve said it before in this post and I’ll repeat it as often as I need to. The most likely scenario is that Ads Manager will report more conversions than GA4 will give credit to your ads.
I hope the reasons are rather obvious:
1. Only Ads Manager can report on view-through conversions. If someone doesn’t click your ad, the URL with UTM parameters will never be loaded. You can’t even rely on Facebook as a source in GA4 since a link wasn’t clicked.
2. Ads Manager is better equipped to track 7-day and 28-day click. The conversions that should match up most closely are those that happened within one day of clicking. But even then, Ads Manager’s numbers may be a little higher than GA4 since those are unlikely to all be immediate purchases.
3. Ads Manager is better equipped to track across devices. This is getting more difficult for any tracking, but someone clicks an ad from their phone while in their Facebook app. That’s a lot of data. That same person moves to their desktop and opens their browser, which is already logged into Facebook. They go to your website and complete a purchase.
4. GA4 may report organic conversions and Ads Manager won’t. Google has no idea whether you paid to reachReach measures the number of Accounts Center Accounts (formerly users) that saw your ads at least once. You can have one account reached with multiple impressions. More someone. While UTM’s might be stripped out when an ad is shared, it won’t necessarily be. That could lead to more conversions reported from Google.
I realize I’ve spent a bunch of words explaining how these numbers won’t add up. But this is intended to provide context for expectations. The 1-day click numbers should be reasonably close to what GA4 reports from Facebook, assuming you’ve properly set up UTM parameters.
One area I’ve found GA4 (which I hate, by the way — LONG LIVE UNIVERSAL ANALYTICS) useful here is for reporting of quality metrics like time spent and other events performed. Here’s an example…
I ran a traffic campaign as an experiment, and I was seeing really good results in Ads Manager — even from my custom events that track quality traffic activity like time spent and scroll. But when I cross-referenced those results with GA4 using UTM parameters, I was given a completely different picture. GA4 said that the average time spent on the page was 4 seconds.
Now, maybe there’s a reason why GA4 may provide suppressed results for time spent. But it at least made me doubt the Ads Manager results enough to think about digging deeper.
6. Breakdown by PlacementA placement is a location where your ad is shown. Examples include Facebook's mobile Feed, Messenger, Instagram feed, Audience Network, right-hand column, and more. More
Up until now, the focus has been on conversion results that are too good to be true. But this is also extremely common when optimizing for actions further up the funnel.
If you optimize for link clicksThe link click metric measures all clicks on links that drive users to properties on and off of Facebook. More or landing page viewsLanding Page View is a Facebook ads metric that represents when people land on your destination URL after clicking a link in your ad. More and get an insanely good Cost Per Action, be skeptical. Use the breakdown feature and take a closer look at the performance by placement.
Check this out as an extreme example…
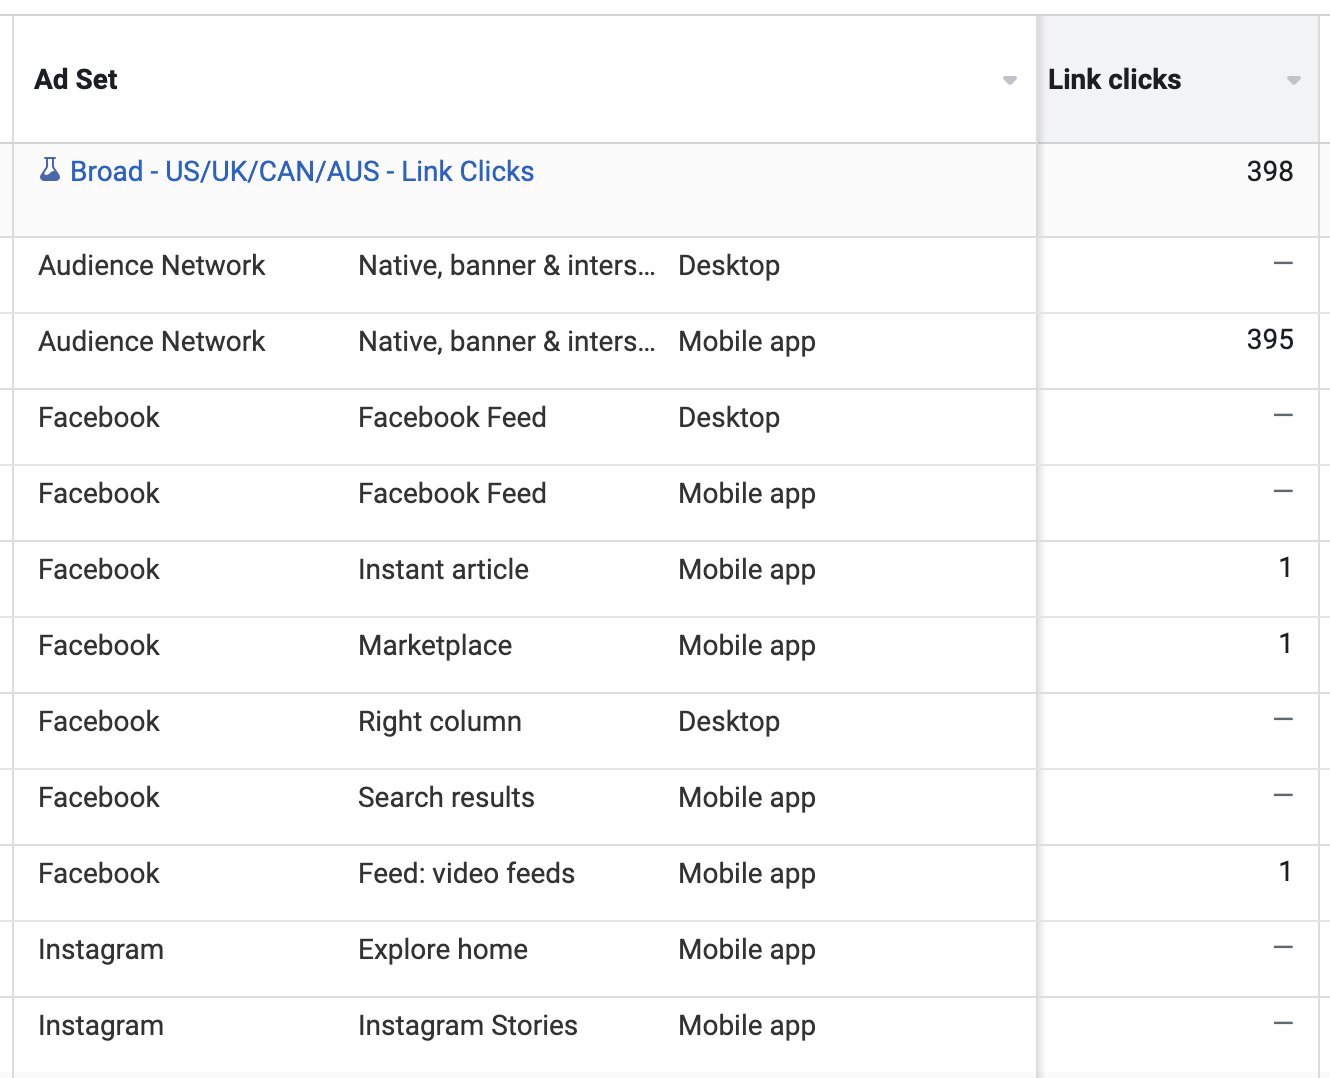
Nearly every link click was from Audience Network. It’s a placement with a bad reputation as a source of bots, accidental clicks, click fraud, and overall low-quality results.
Amazingly, Audience NetworkAudience Network is a network of mobile apps that have been approved to monetize their apps with ads. This is how you can show your Meta ads to people while they are away from the Meta family of apps. Audience Network and associated groups are among your placement selection options in the ad set. More can also be a problem when optimizing for ThruPlaysThe number of times your video was played for at least 15 seconds or to completion. More. In particular, the culprit is Audience Network Rewarded Video.
Here’s another crazy example…
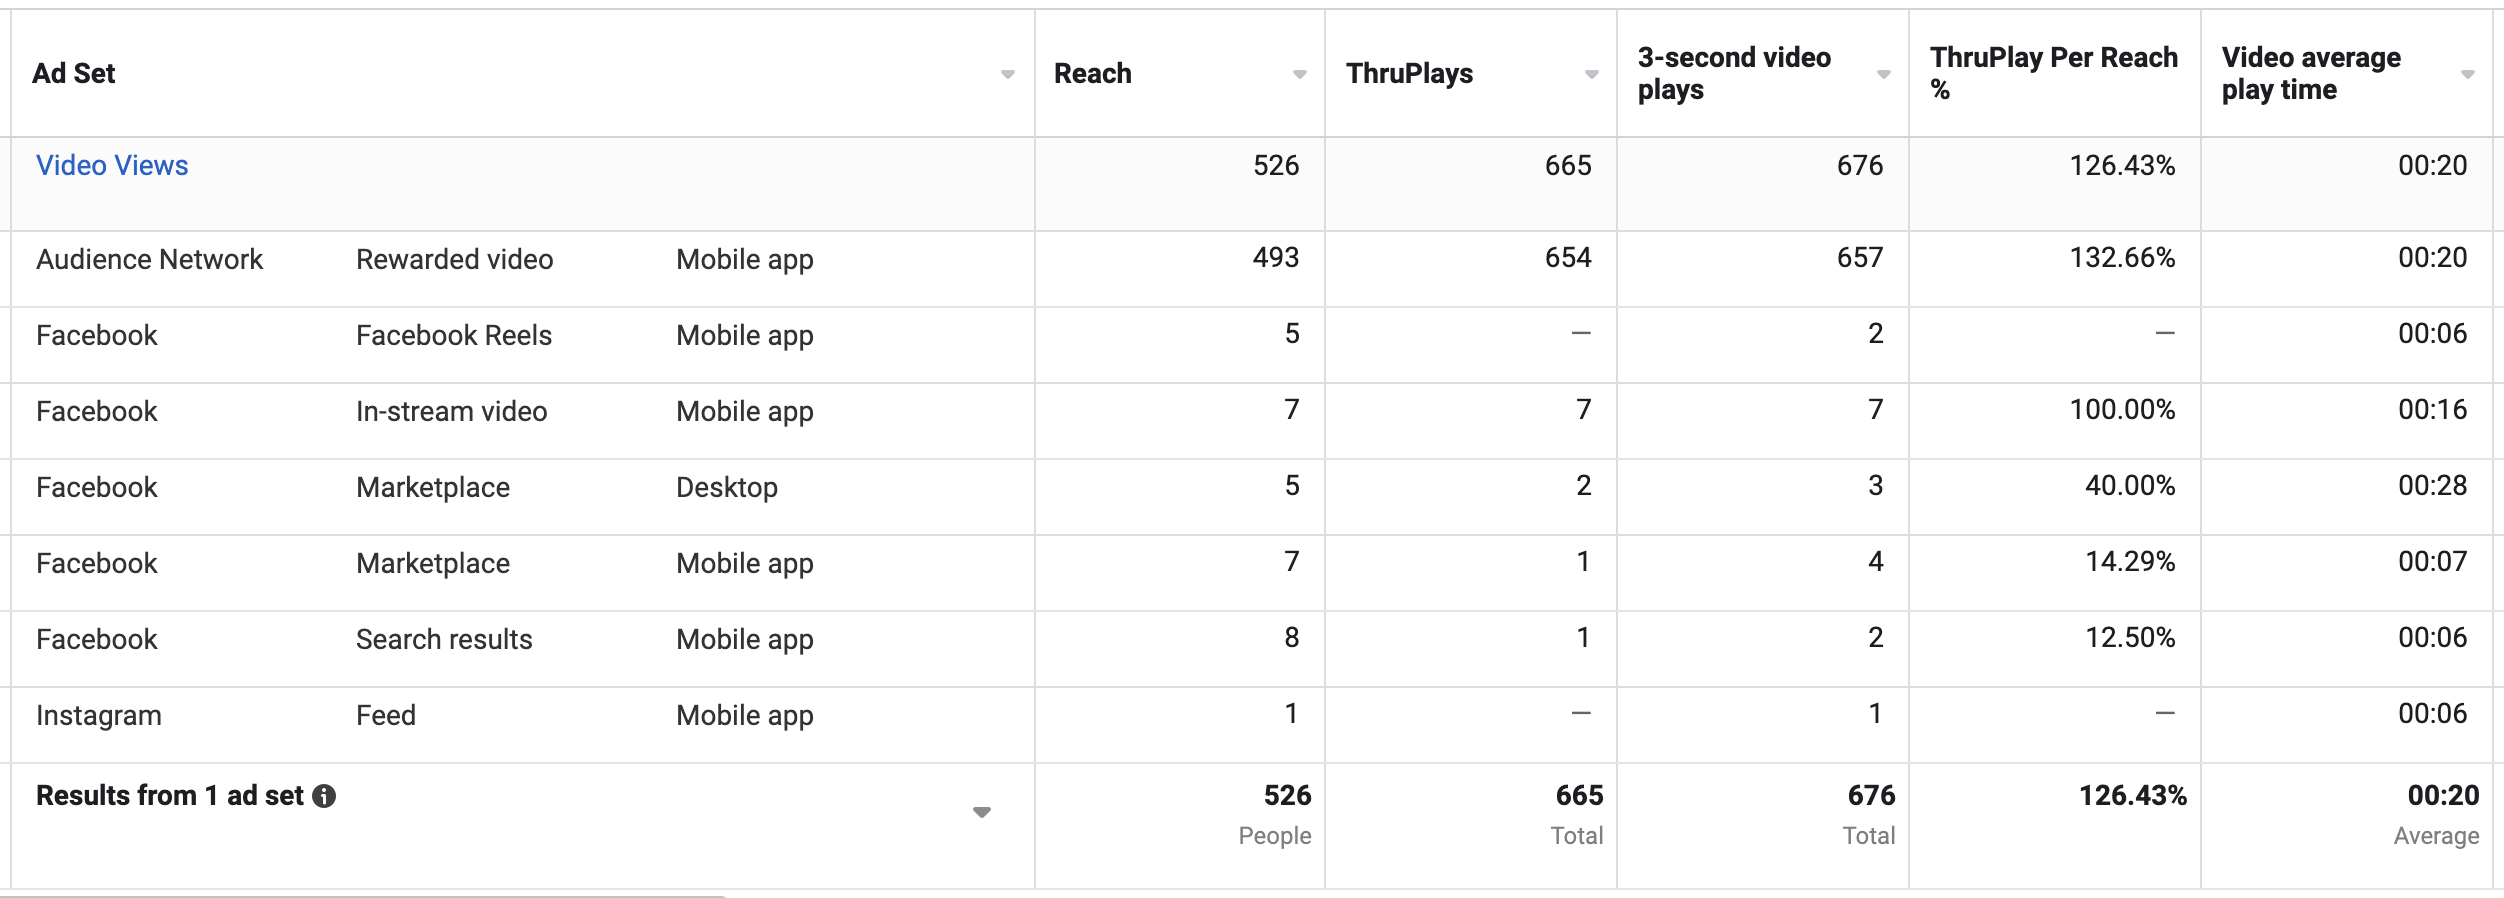
The AudienceThis is the group of people who can potentially see your ads. You help influence this by adjusting age, gender, location, detailed targeting (interests and behaviors), custom audiences, and more. More Network Rewarded Video was driving more ThruPlays than actual people reached — by a lot.
This is because Rewarded Video is a way for apps to monetize themselves with ads. Users of those apps are given the ability to view videos in exchange for virtual currency or something else that can be used in the app.
In other words, they likely have no interest in the video at all. They’re just trying to get that reward. And this is almost always reflected in the results — beyond the ThruPlay, these people rarely do anything else.
7. A Note on Small Sample Sizes
And finally, it’s important to drop the reminder that sample size matters. It matters a whole lot.
You may get some amazing results for a day that could be driven by a handful of conversions. And if you’re running a remarketing ad, your potential audience may be seriously limited.
Those results may be legit. But if they’re a small sample size without the ability to scale, you shouldn’t expect those results to continue.
Ultimately, we want scalability, consistency, and predictability. You’re not going to get that with small sample sizes.
Your Turn
I’m sure I forgot something. Is there another source of results that are too good to be true?
Let me know in the comments below!