
The Creator’s Guide to YouTube Shorts Analytics
In this article, we walk through the key metrics made available about YouTube Shorts analytics and how to interpret them to optimize your content for better performance and growth.


Content Writer @ Buffer
Everyone is focused on the YouTube Shorts algorithm as the key to growing as a creator on the platform. While it’s an important part of growth, it’s only one piece of the puzzle. Instead of hyper-focusing on what you can’t control (the Algorithm), focus on what you can – your own results.
And how do you find these results? Through your analytics. YouTube offers different content types, each with robust analytics. But it can be overwhelming to go through each one and understand what the terms mean.
In this article, we’ll walk through the key metrics made available in YouTube Shorts analytics and how to interpret them to optimize your content for better performance and growth.
How to find your YouTube Shorts analytics
Whether you prefer analyzing data on a desktop or on the go via mobile, YouTube has got you covered. Here’s how you can access YouTube Shorts analytics on both platforms:
On desktop
To view the analytics of a specific Short, start by logging into YouTube Studio on your desktop or going to your YouTube homepage and clicking your profile picture and then YouTube Studio.
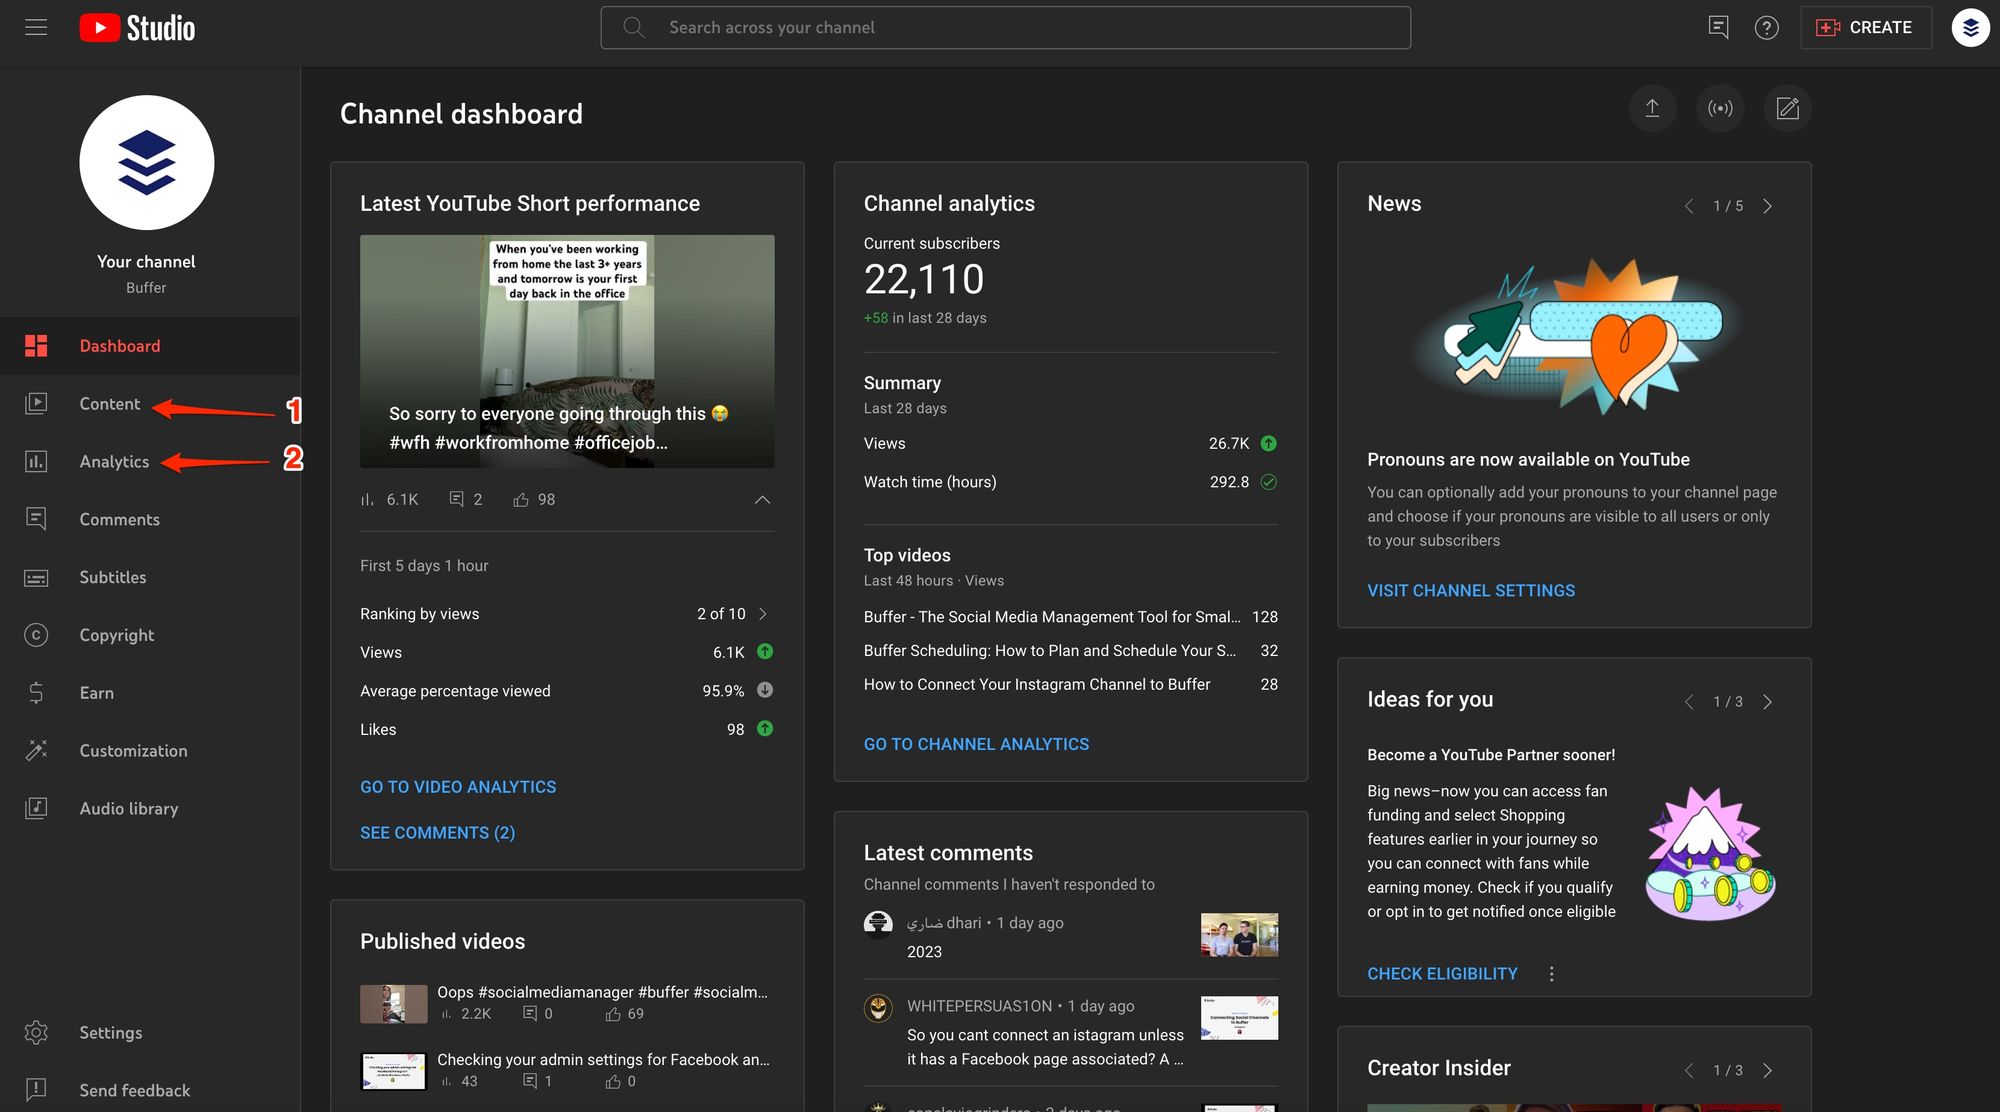
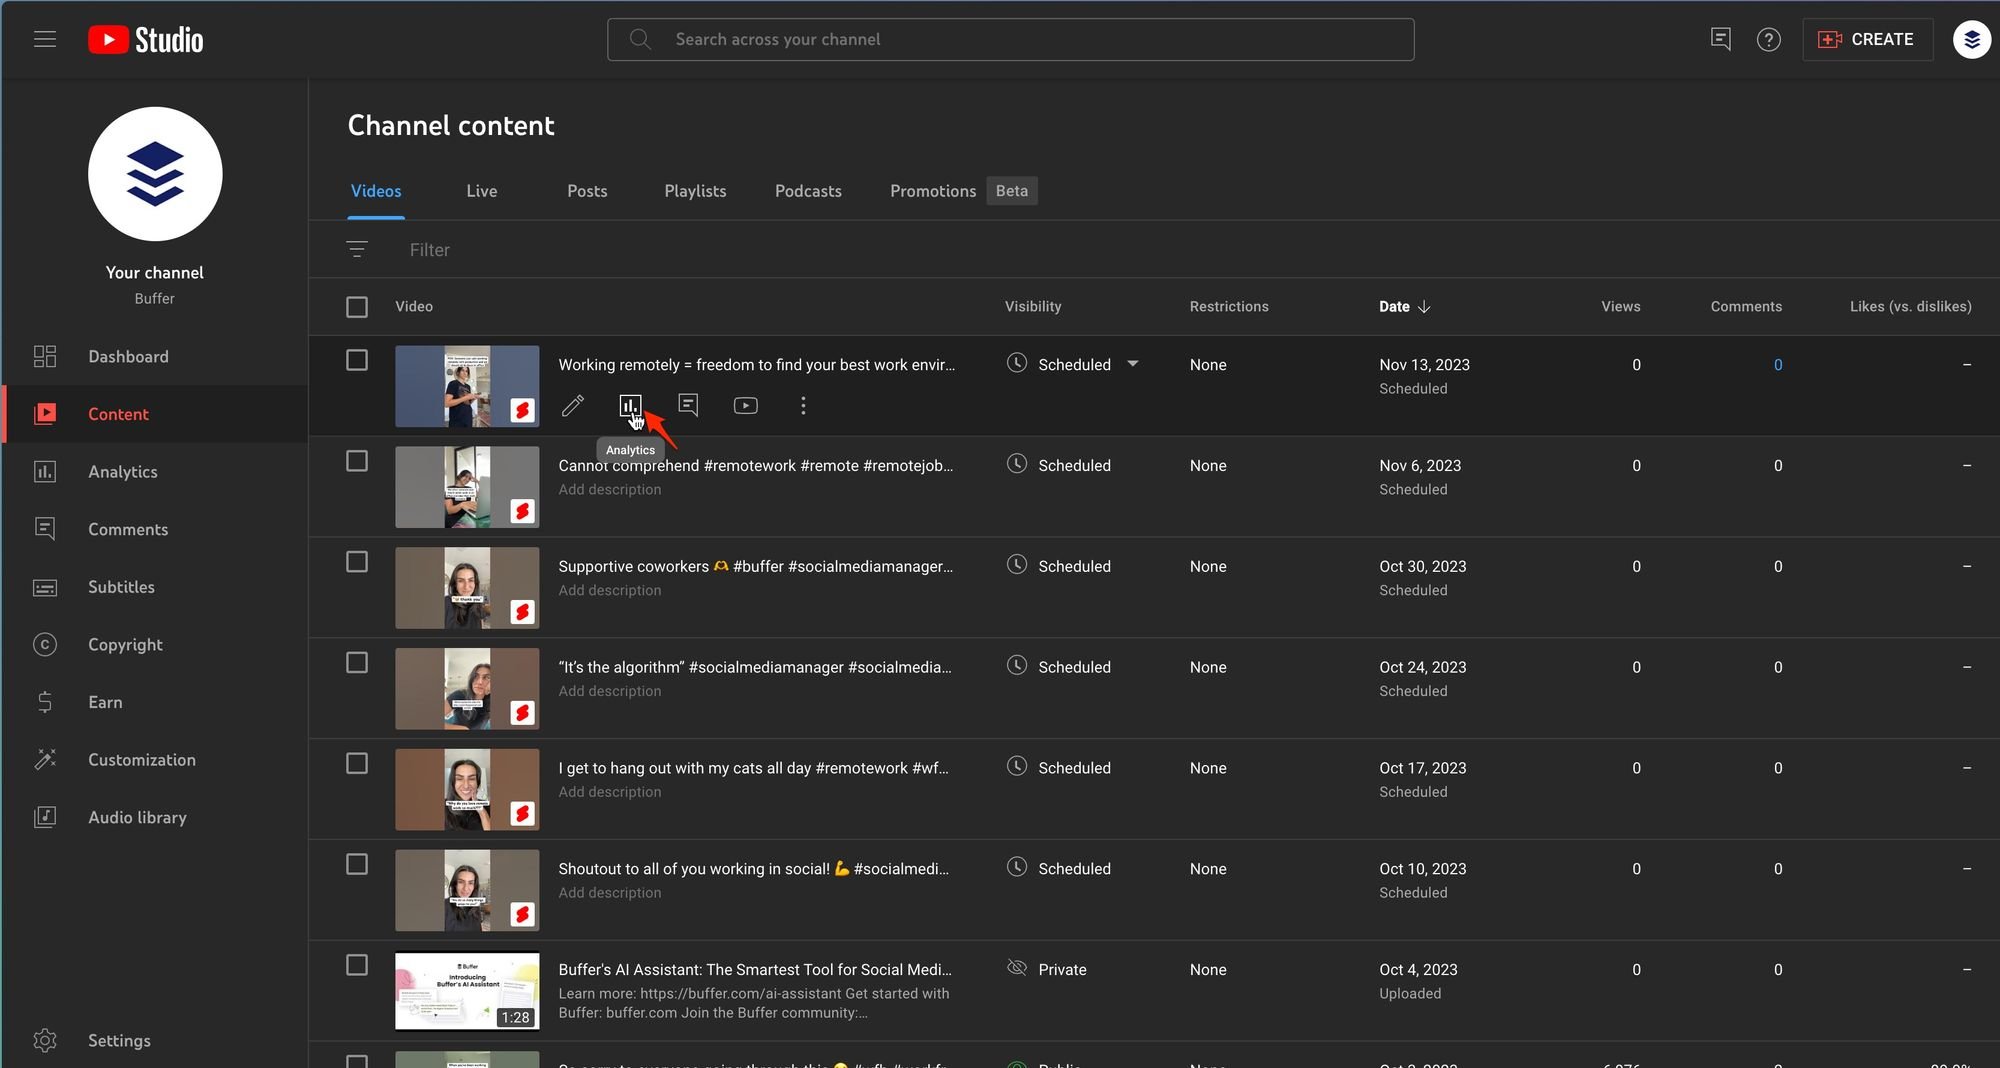
In the left-hand menu, click on the 'Content' tab to see a list of all your uploaded content. Hover over the video whose analytics you want to view, and click on the 'Analytics' icon next to it. This will lead you to a page displaying various metrics specific to that video, giving you a snapshot of its performance.
For a broader view of how your Shorts are performing on a channel level, again head to YouTube Studio and click on 'Analytics' from the left-hand menu. Here, you’ll find an overview of your channel’s performance, including data on your Shorts.
For a more detailed insight, click on ‘See More’ under the Views section, then click on ‘Traffic Source’, and finally select 'YouTube Shorts' to filter the data accordingly.
You can (and should) also dive into ‘Advanced Mode’, which shows more detailed insights into traffic sources to your content and audience demographics.
On mobile
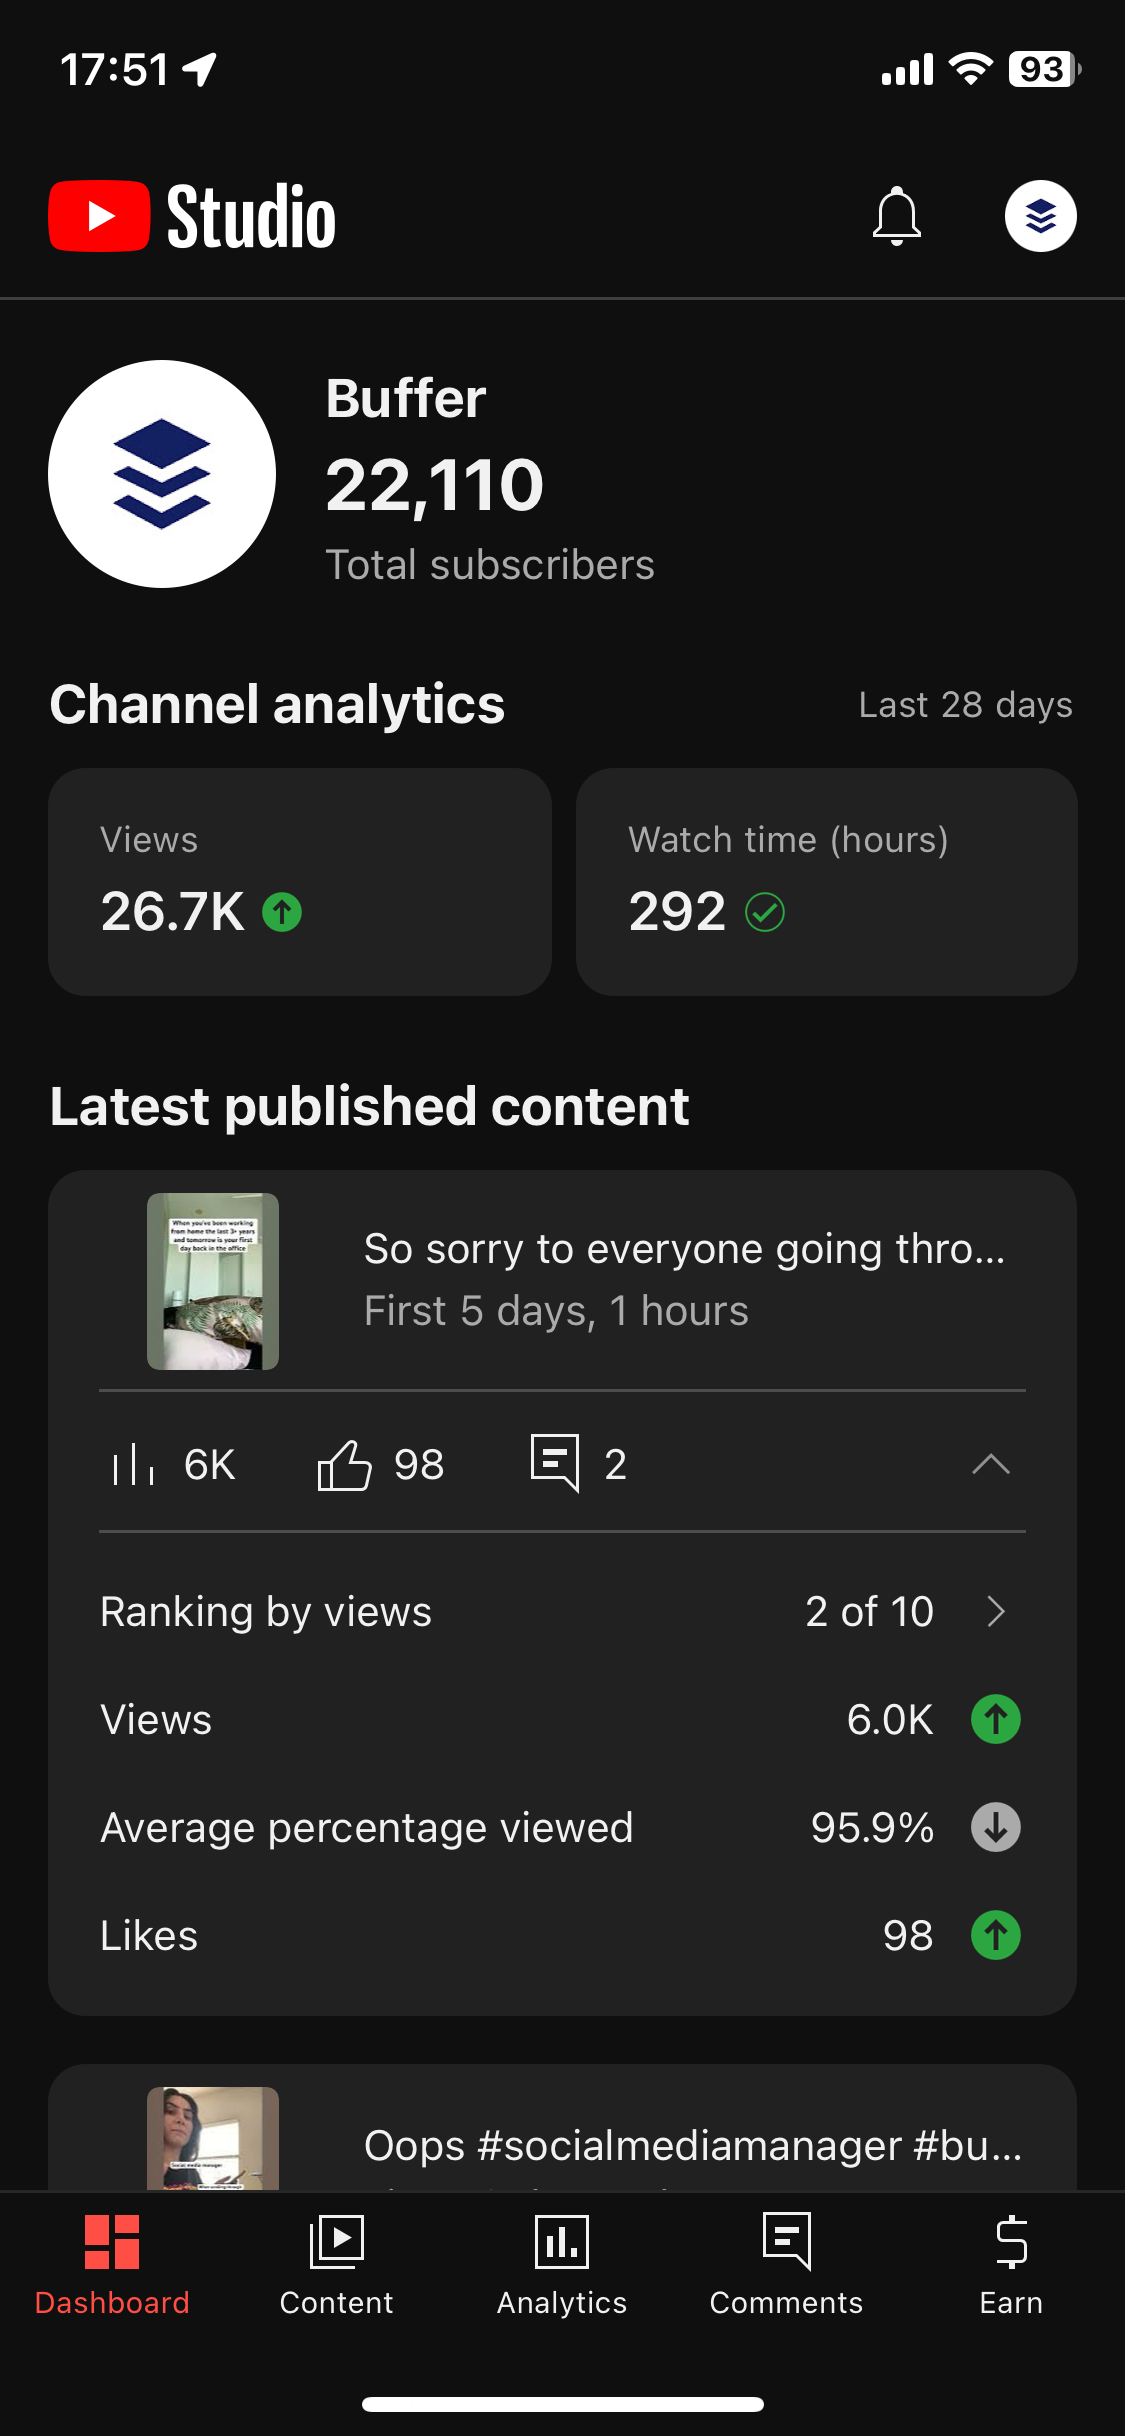
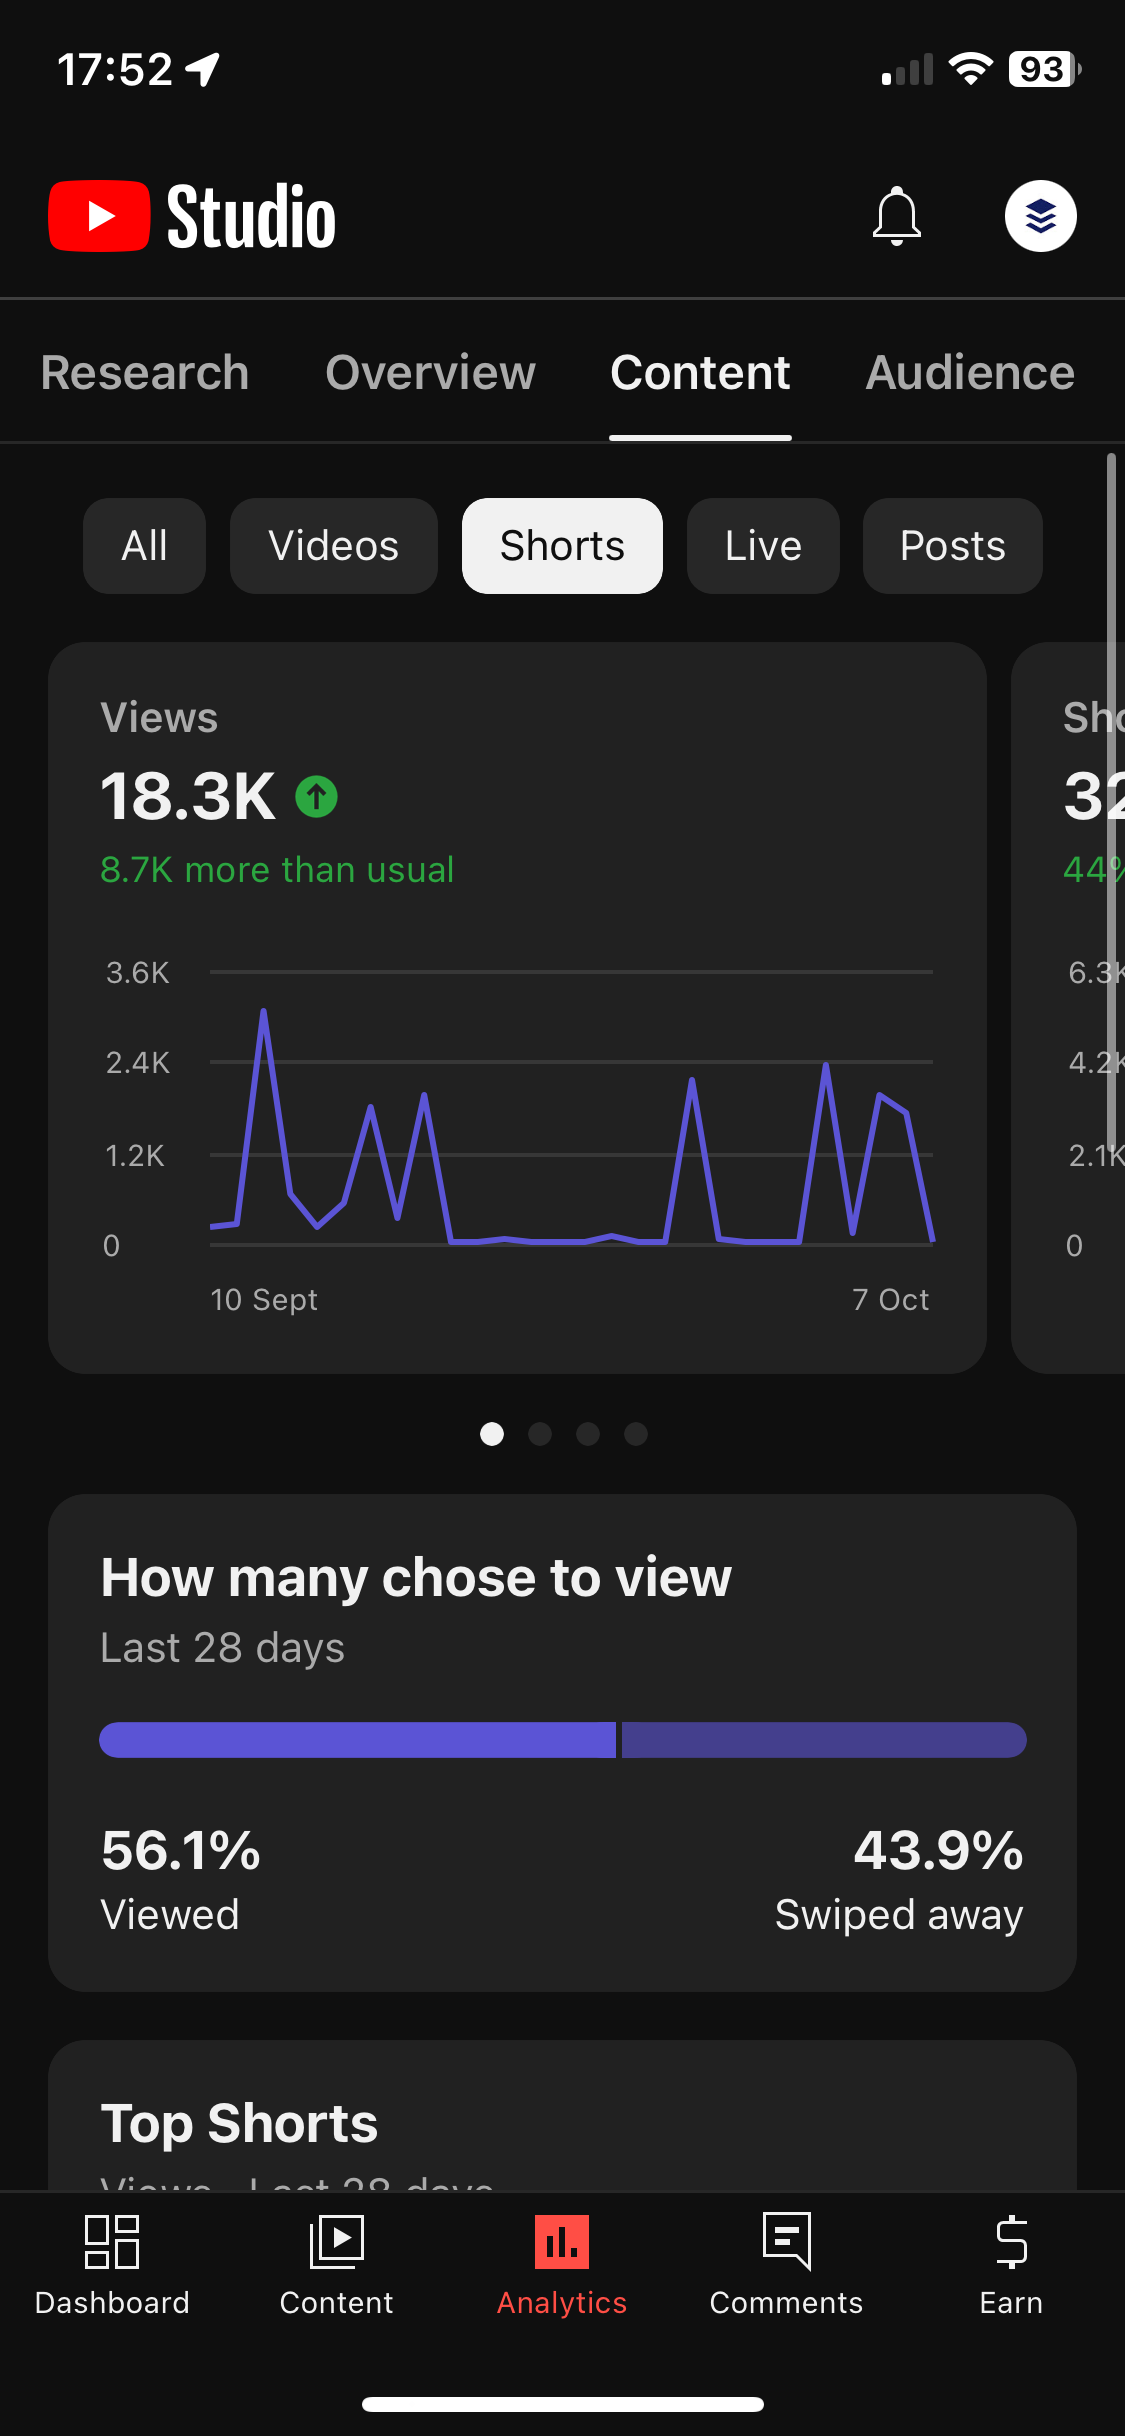
The YouTube Studio app is a handy tool for creators who prefer monitoring their channel's performance on mobile. Once you've downloaded and logged into the YouTube Studio app, tap on 'Analytics' at the bottom of the screen. Then, tap on any tabs to see your detailed analytics reports.
YouTube Shorts analytics to monitor
Analytics are like a mirror reflecting the impact and reach of your content, but understanding the key metrics is crucial to make sense of this reflection.
Channel-wide analytics
When you visit the ‘Analytics’ tab from the left-hand menu, you’re presented with four tabs in your broad Channel Analytics dashboard – Overview, Reach, Engagement, and Research. In these tabs, you’ll find all the information on how your content performs that you can use to improve your content strategy.
Overview
In the Overview section, you can see a graph showing metrics from 7 days to Lifetime. The metrics are:
- The number of views your channel has received over a certain time
- Total watch time of your videos in hours
- The number of subscribers you’ve gotten over a certain time
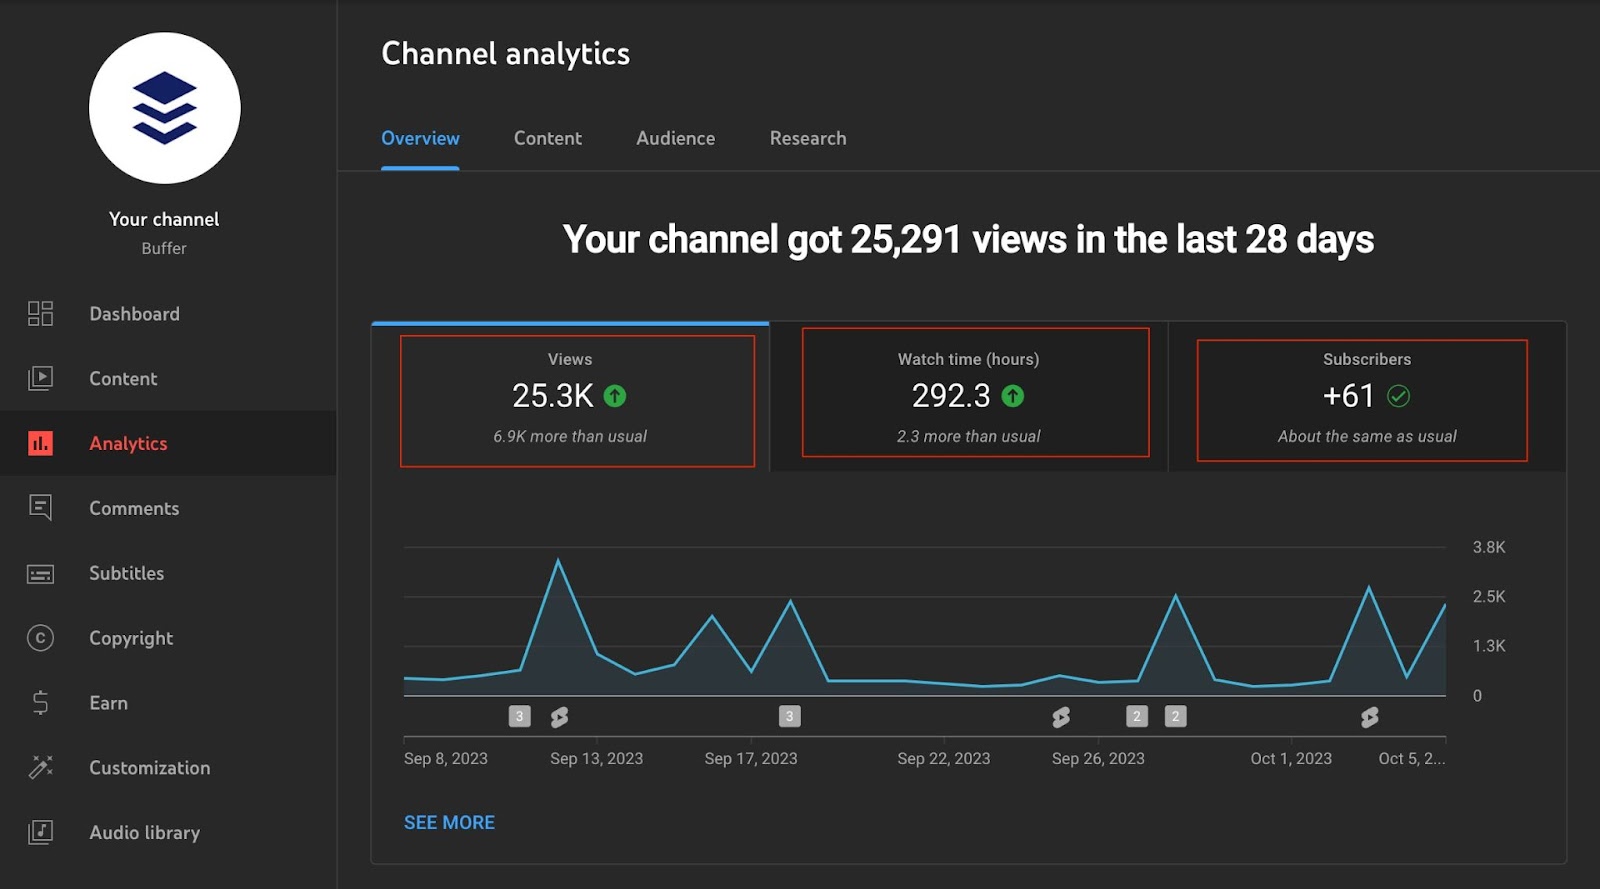
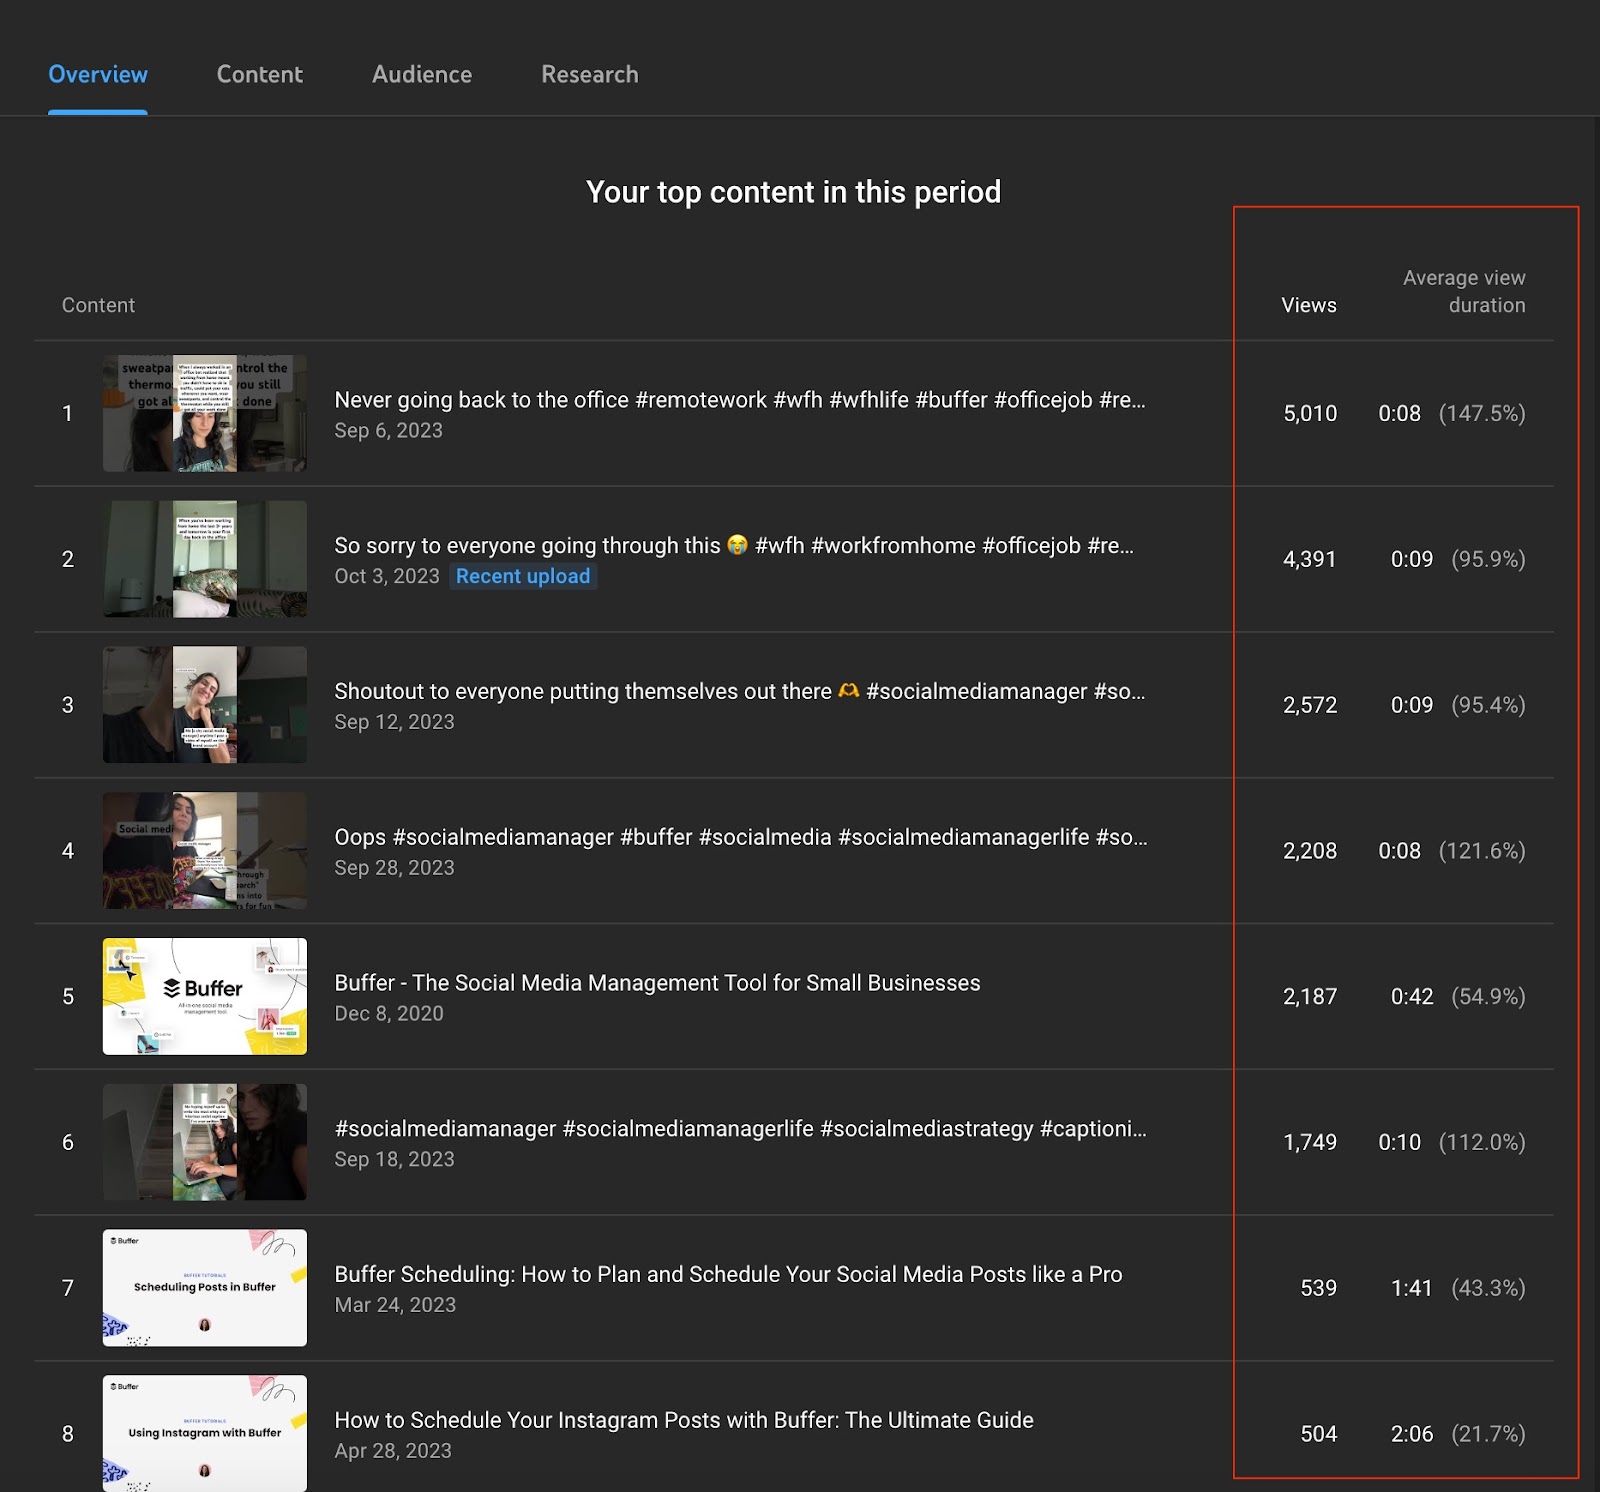
You can also see an overview of the top content you’ve published in a selected time period and a summary of the total views and average view duration.
Content
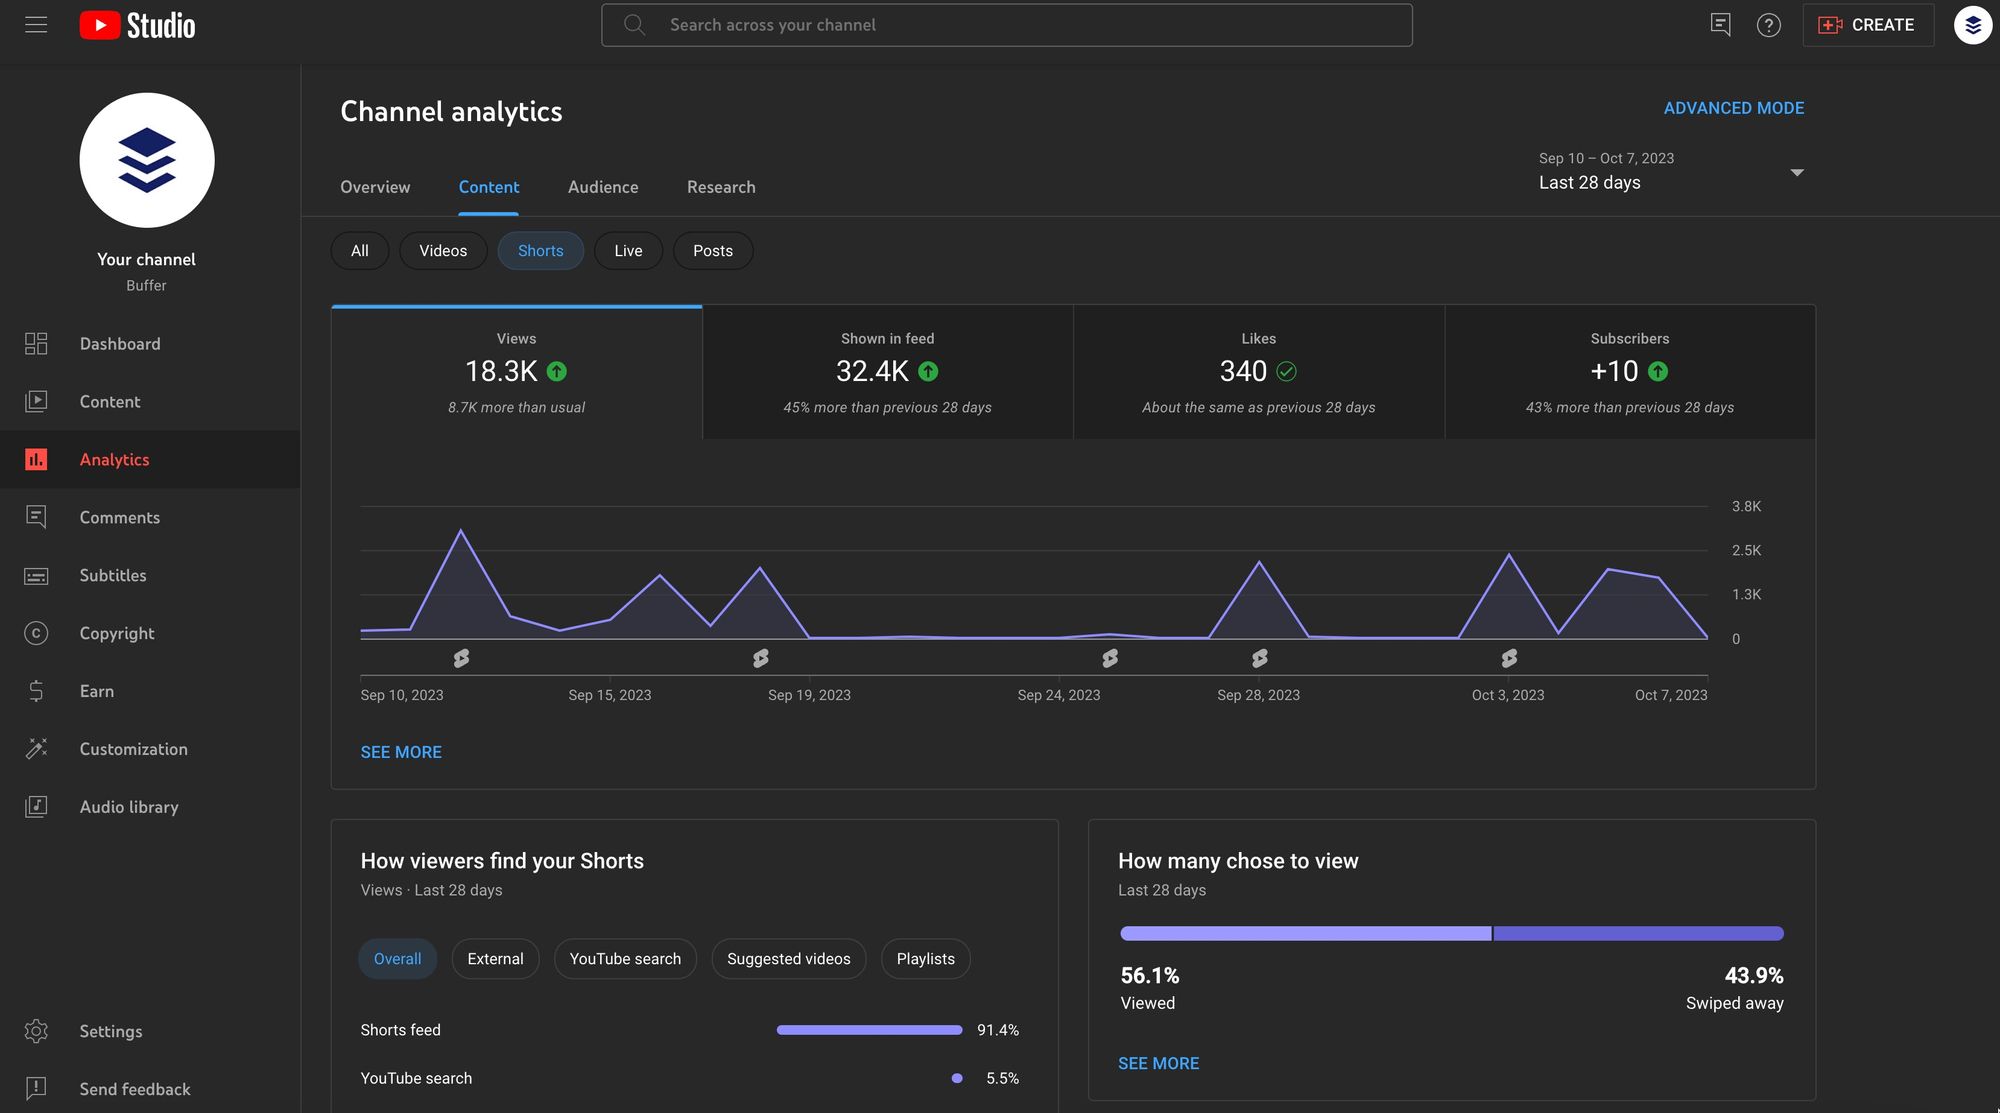
The Content section gives a detailed look at how your content is displayed and engaged. Best of all, you can see the data specific to your Shorts by clicking on the corresponding filter.
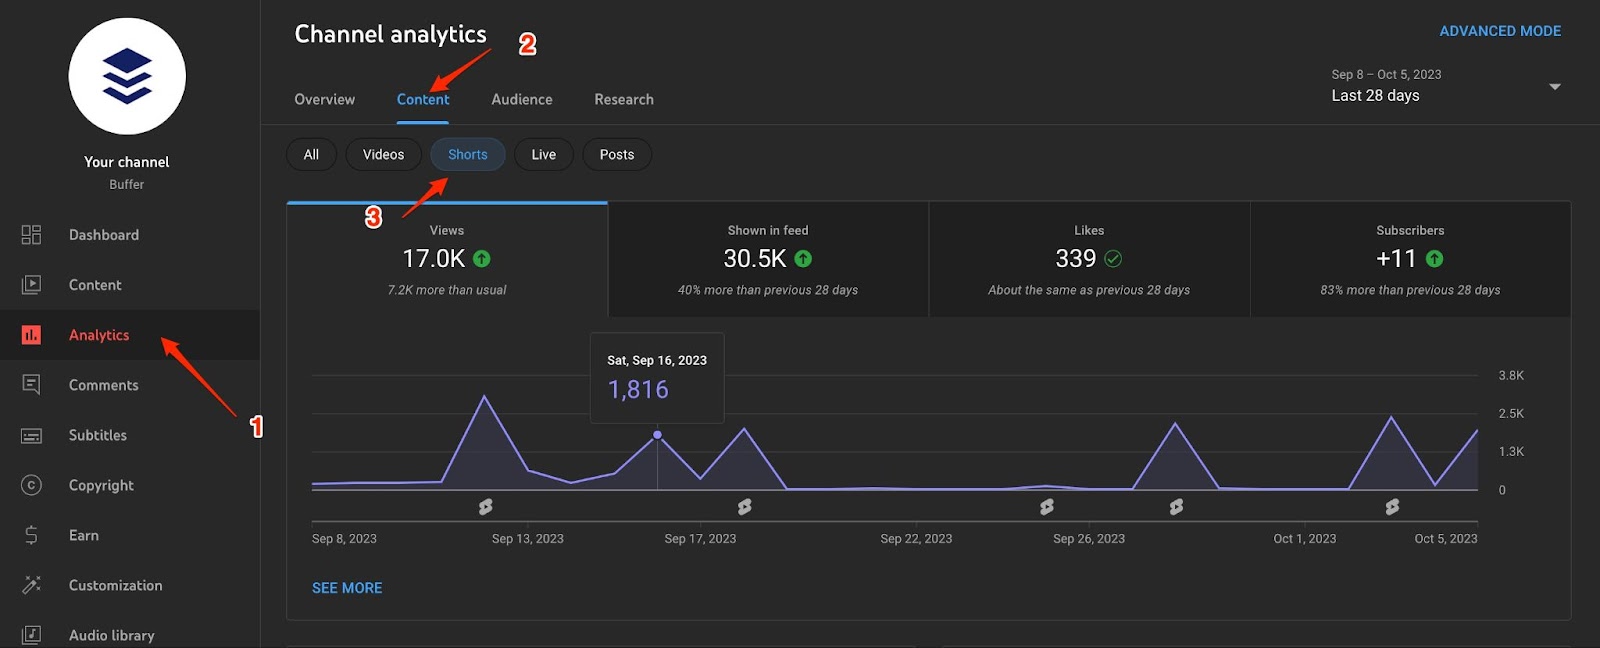
Here, you get a look at the broad overview of your Shorts performance through graphs of four key metrics in a selected time period:
- Views – this shows the number of times your Shorts were viewed
- Shown in feed – this shows the number of times your Shorts were shown in the YouTube Shorts feed
- Likes – the total number of likes you’ve gotten
- Subscribers – the total number of new subscribers through Shorts
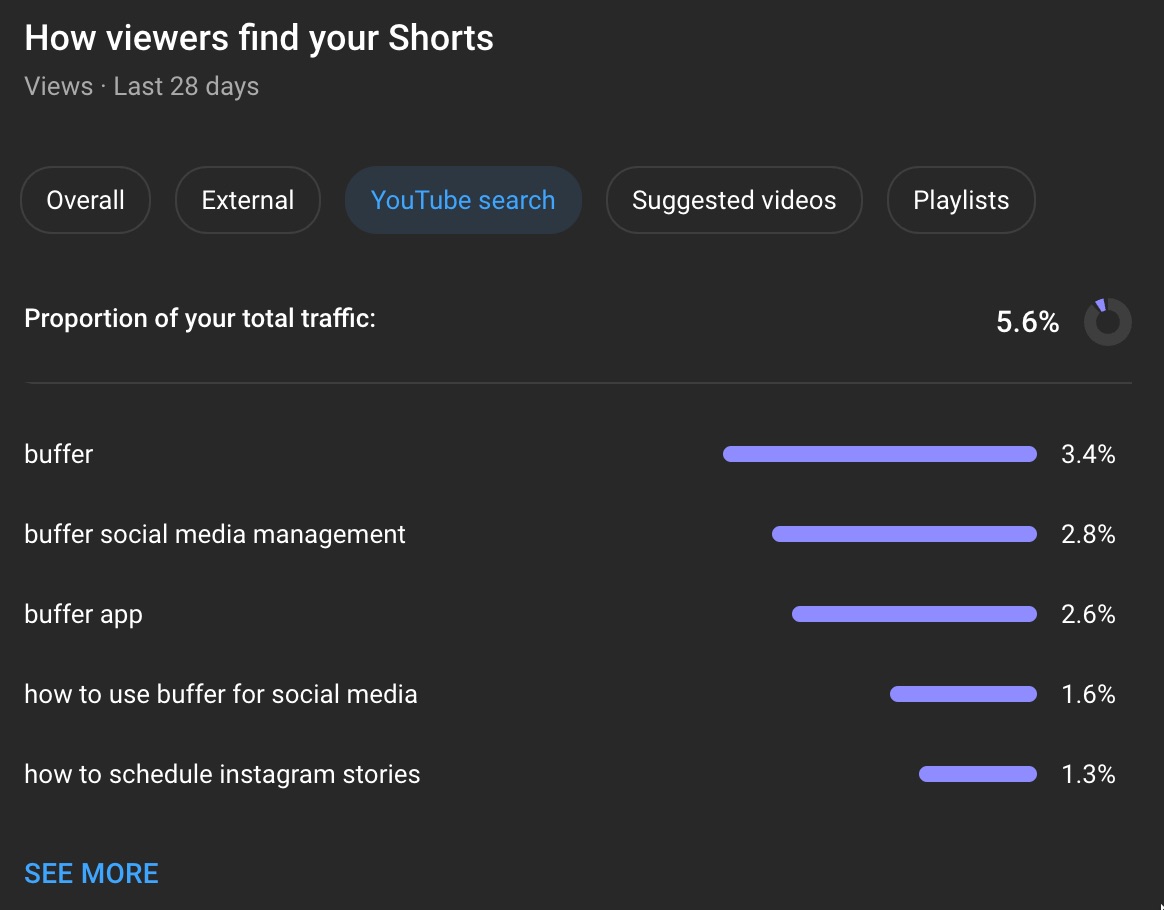
The next section shows how your Shorts are being discovered, and you can further select each view to show which search terms or websites are directing traffic to your content.
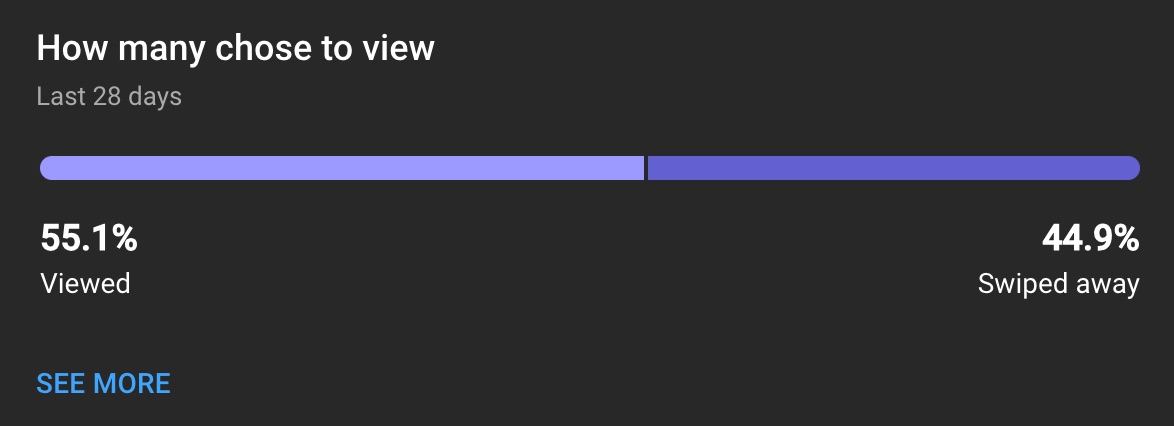
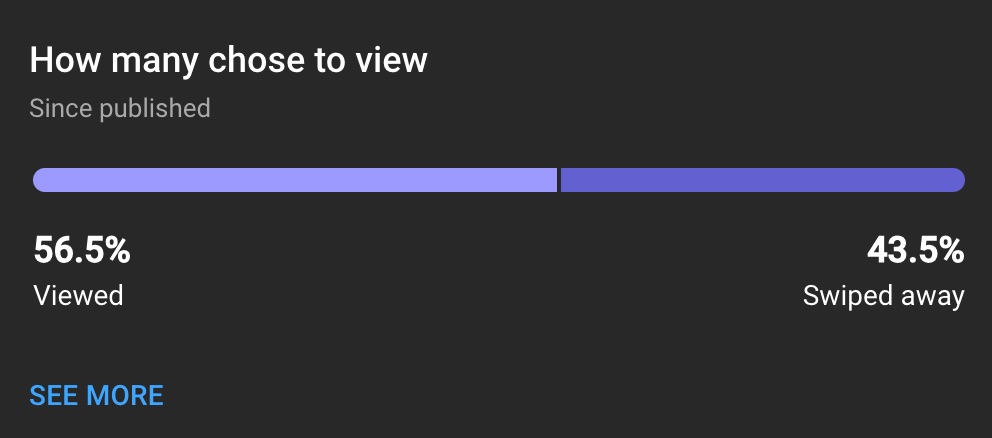
The section beside this one shows one of the most important metrics for ranking in the algorithm – viewed vs. swiped away. If the percentage of the former is higher, then your content is performing great. Your focus should be on making sure that the average of this metric across your content remains high.
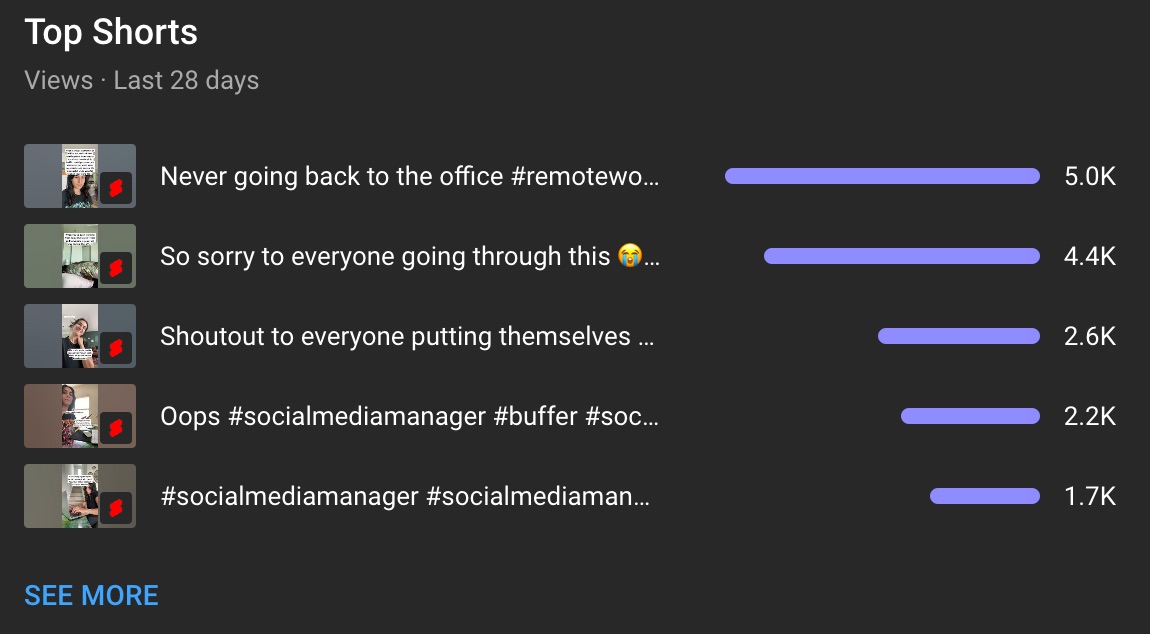
You can also see your best-performing Shorts. Use the performance of your top content to determine which ideas and tactics you run with in the future. For example, if several of your top videos used lots of hashtags, then that’s a sign that you should use that tactic going forward.
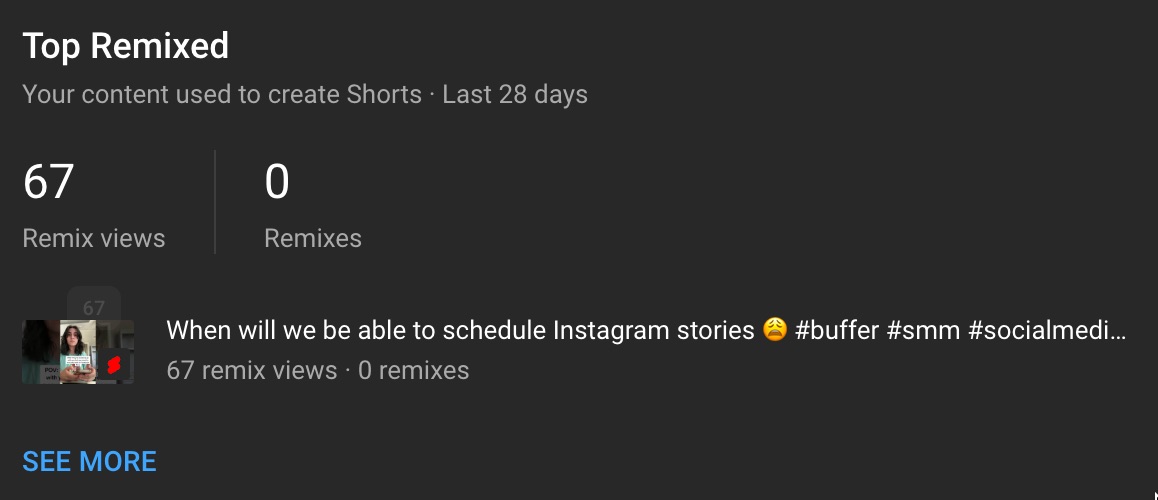
Last but not least, you can see how many times your content was Remixed by other creators.
These metrics are very helpful and important, however, if you publish both long and short-form videos or any other mix of content types, they may not tell you exactly what you need to be doing with your Shorts. So, you have the option of diving into individual video analytics. Here’s how.
Video-specific analytics
To see analytics specific to your short-form videos, click on any individual Short video to view a page with four tabs – Overview, Reach, Engagement, and Audience.
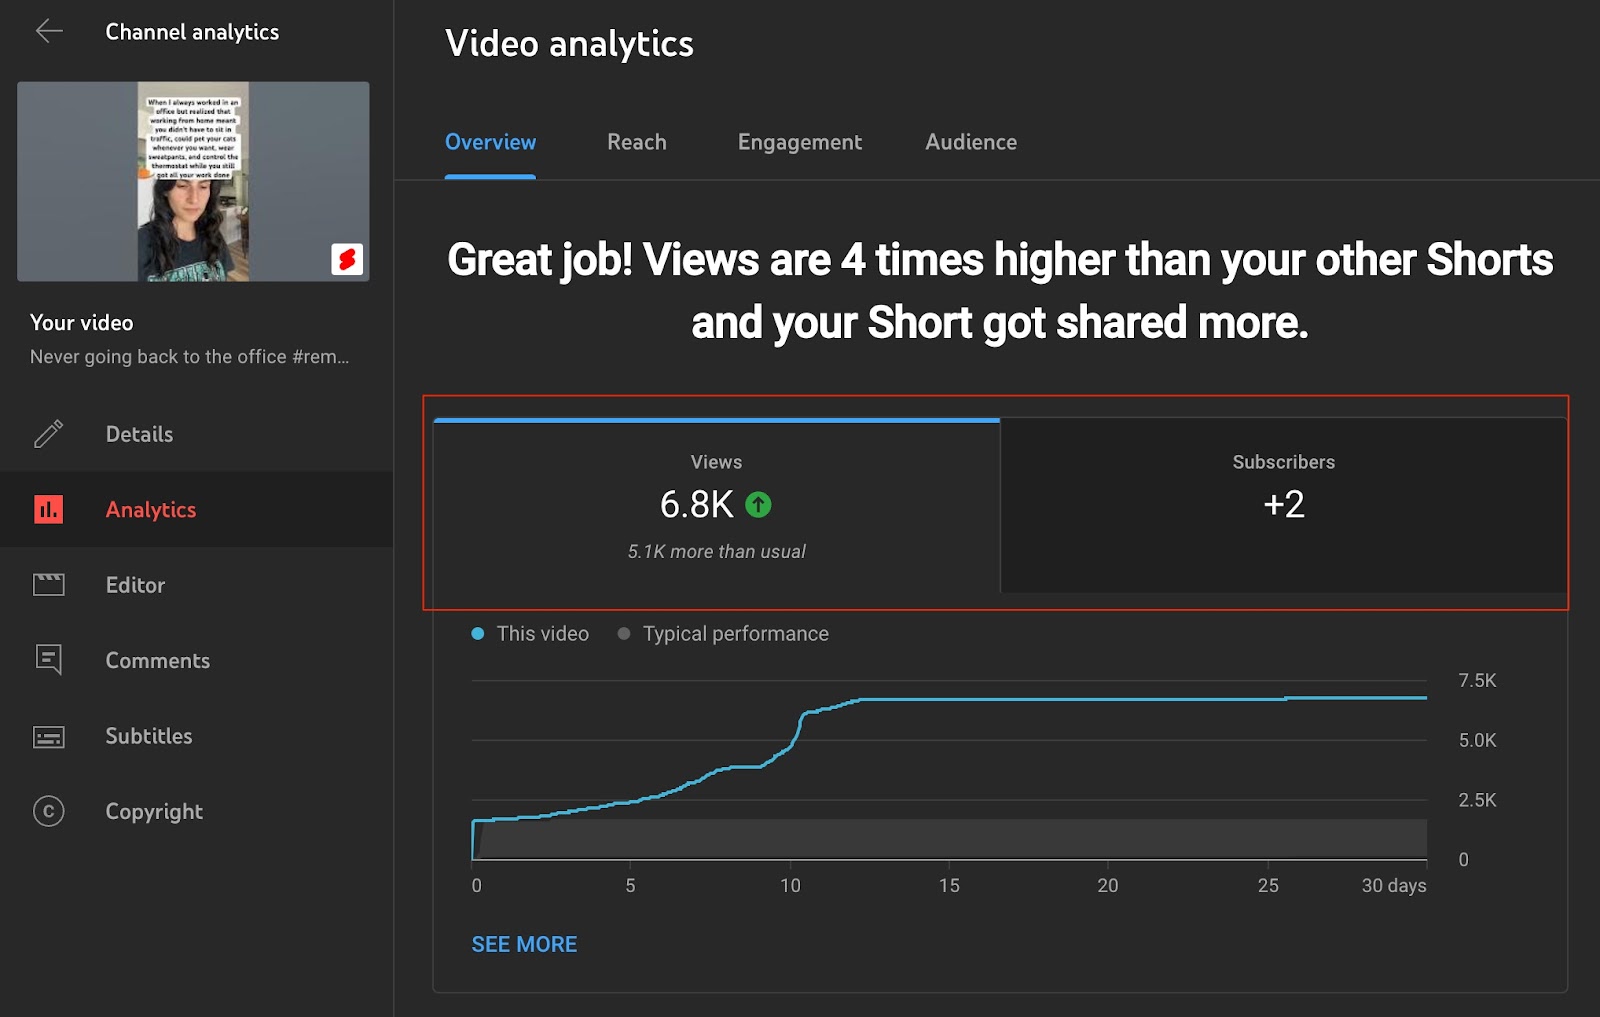
Overview
The Overview tab contains a broad look at the performance of your video since it was published. Here, you can see a bar graph showing
- The number of views a Short has gotten
- The number of people who subscribed while watching that video
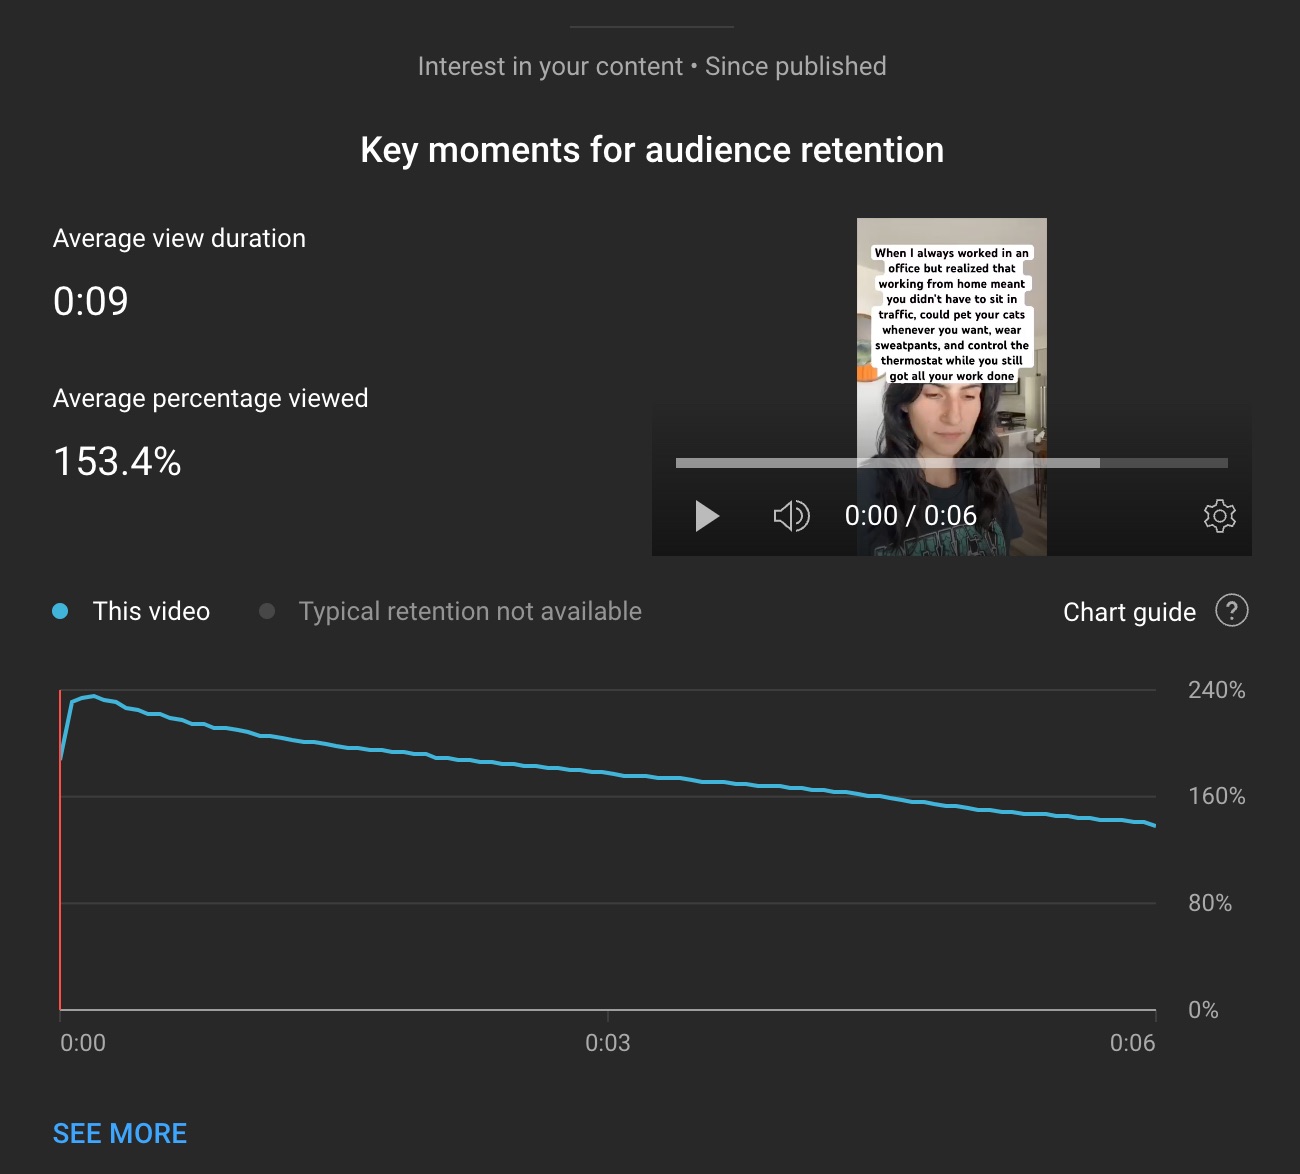
You’ll also see a section for ‘Key moments for audience retention’, which shows the average view duration and ‘average percentage viewed’, metrics that show how long people watched your video before swiping away on average.
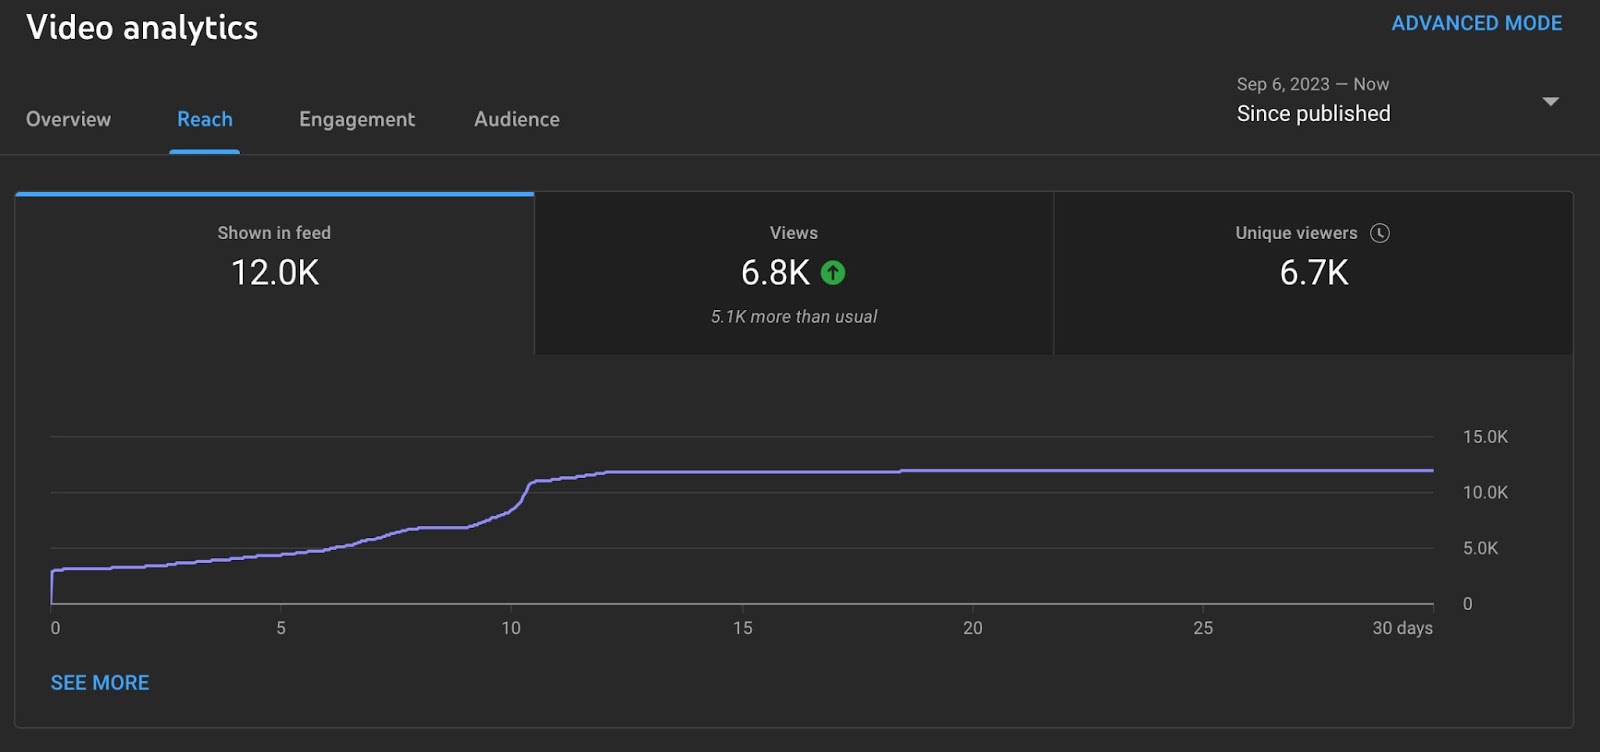
Reach
The Reach tab shows three metrics in a graph:
- Views
- Shown in feed
- Unique viewers
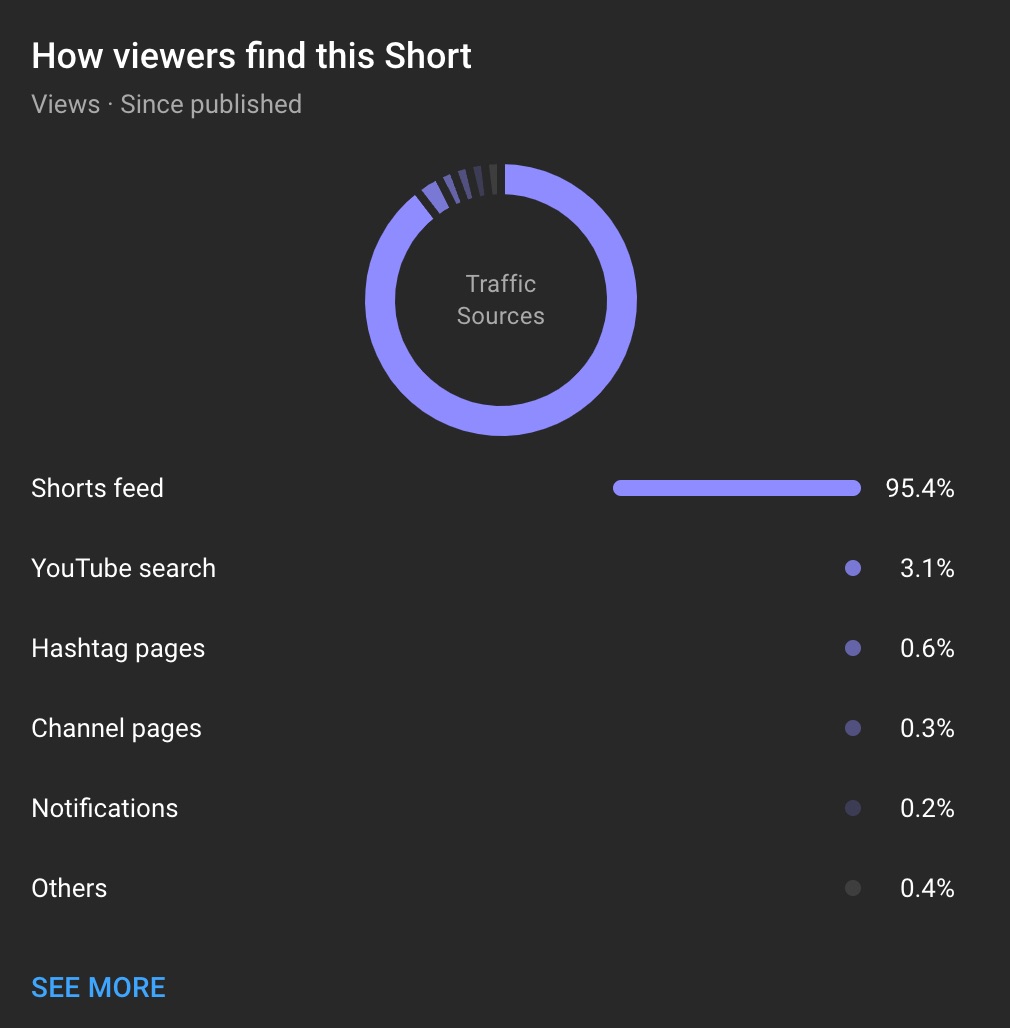
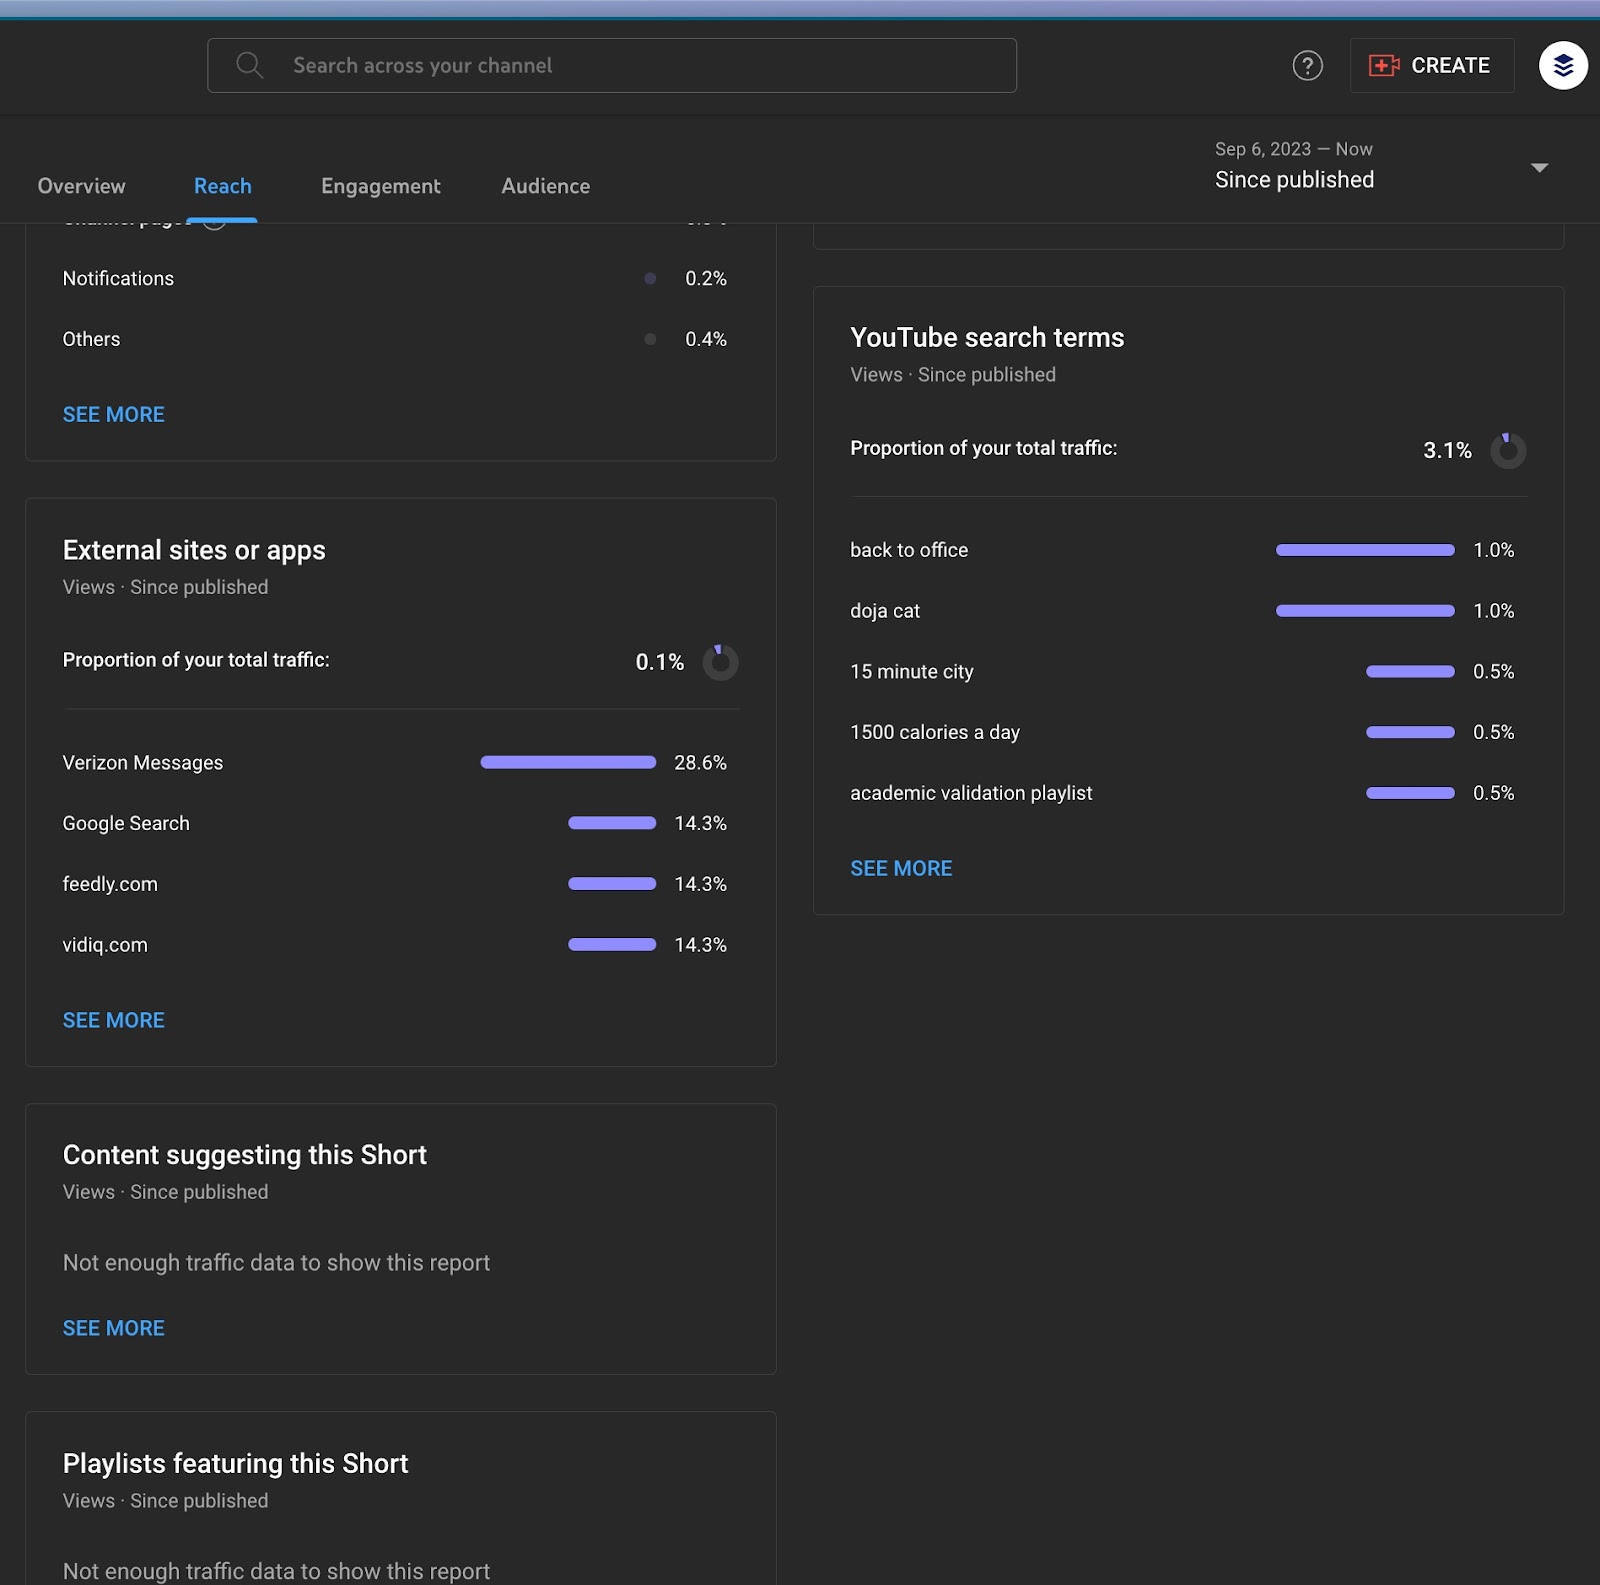
You can also see ‘How viewers find this Short’, which shows where traffic to your content is coming from, like the Shorts feed or YouTube search results.
This is also where you can see How many chose to view vs. swiped away for an individual video. Again, the higher the Viewed percentage, the more you should study that video for what you did right.
Other metrics shown in the Reach tab include:
- Views from external sites or apps – which shows if views came from your
- Short being embedded somewhere outside YouTube
- Content suggesting this Short
- Playlists featuring this Short
- YouTube search terms your video appeared under
- Bell notifications sent to people who have your notifications turned on
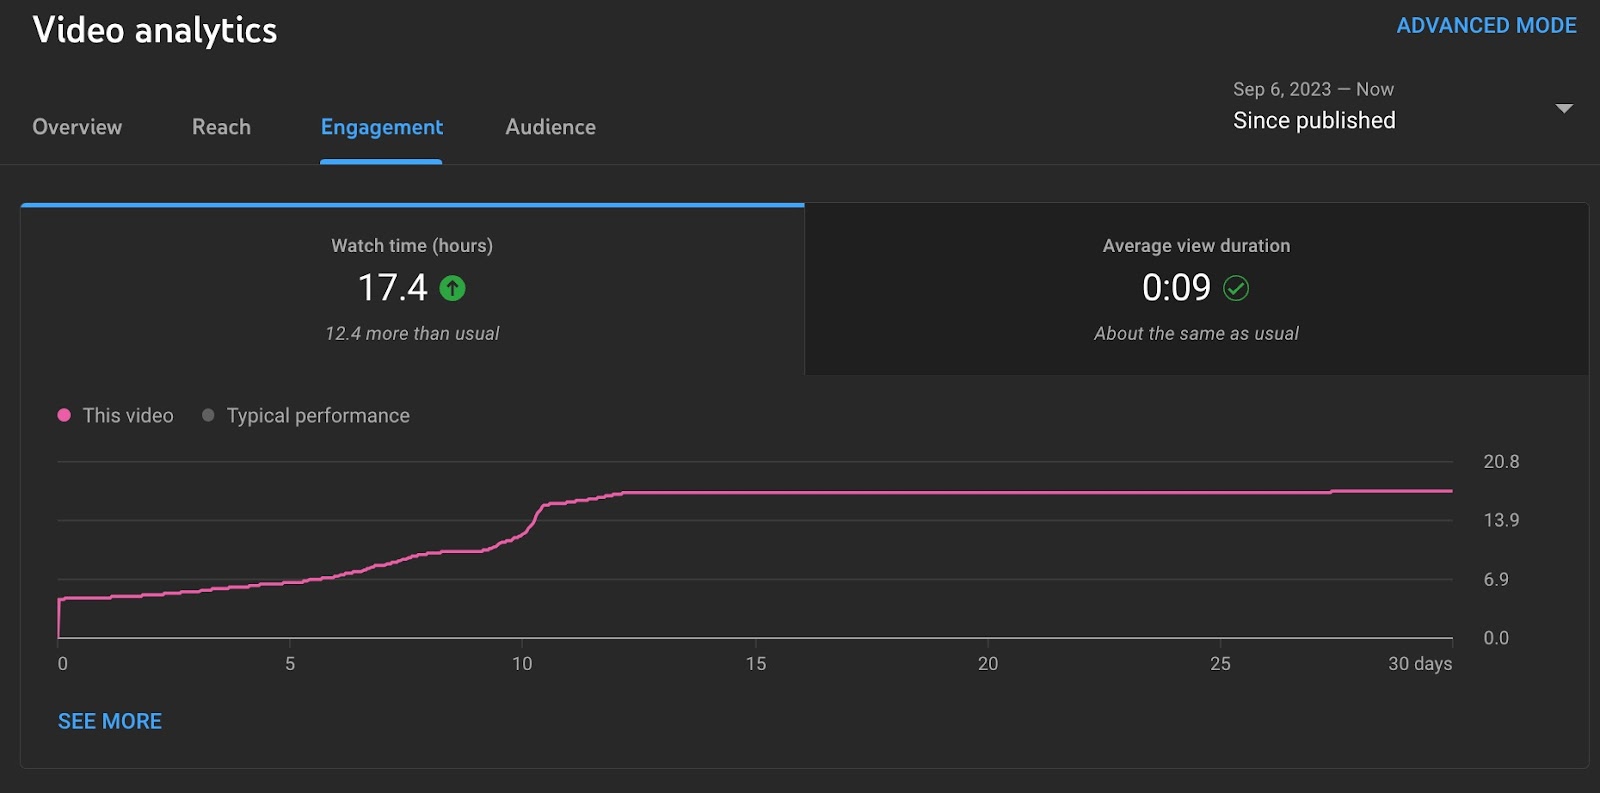
Engagement
In this section, you can see how long people are watching your videos for, as well as the ratio of likes to dislikes.
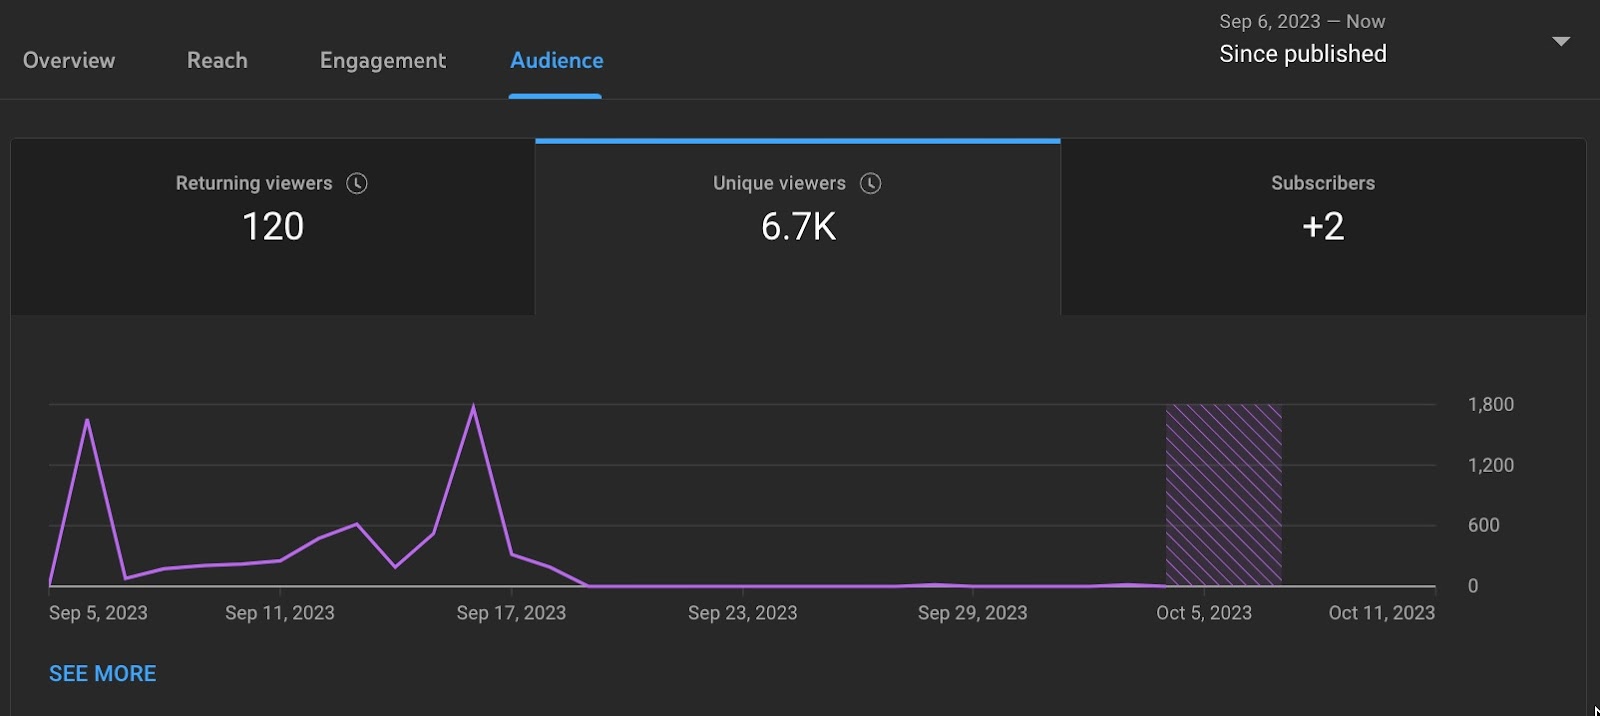
Audience
In this tab, you can get detailed insights into who is viewing your video. The graph section shows the following metrics:
- Returning viewers – people who have watched your content before
- Unique viewers – total number of people who watched your video
- Subscribers – the people who subscribed after watching the video
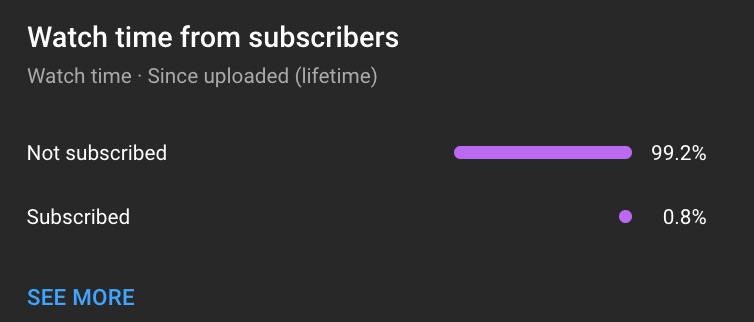
You can also see the watch time from people who are subscribed to your channel vs. not subscribed. If the number of non-subscribers is higher, consider adding a CTA to your subscribe to your channel in the caption, comments, or in the videos themselves.
You can also see age and gender demographic information in this tab as well as the geographical location of your viewers.
12 ways to improve your Shorts performance based on your analytics
The amount of information you get about your analytics is helpful, but only if you know what to do with it. Here are some actionable strategies tied to various key metrics that can guide your content creation and optimization journey:
- Views and reach: More views translate to broader reach. Analyzing the times of day or days of the week when your Shorts garner the most views can help in scheduling your future posts.
- Likes and engagement: A high like count is a positive affirmation from your audience. Encourage likes by ending your Shorts with a call to action, like asking for a thumbs-up if viewers enjoyed the content.
- Trend analysis: Observing the trends in views and likes over time can show which content themes or styles resonate with your audience.
- Shown in feed metric: The number of times your Shorts appear in the feed impacts their discoverability. Analyzing this metric alongside views and likes can provide a fuller picture of your content's visibility.
- Subscriber growth: A surge in subscriber count post a Short's upload indicates a strong positive response. Pay attention to the content that drives subscriptions to replicate success.
- Viewer loyalty: Consistent subscriber growth reflects viewer loyalty. Engage with your subscribers through comments and community posts to foster a loyal viewer base.
- Traffic source insights: Diving into traffic sources sheds light on how viewers discover your Shorts. Tailor your SEO strategy based on whether viewers are finding you through YouTube search, suggested videos, or external platforms.
- Optimizing for traffic sources: If YouTube search is driving traffic, optimizing titles, descriptions, and tags for relevant keywords is vital. Conversely, if traffic comes from external platforms, consider focusing your promotional efforts there.
- Engagement beyond views: Comments and shares are indicators of deeper engagement. They signify a level of audience interaction that goes beyond passive viewing, providing insights into how your content resonates on a deeper level.
- Encouraging interaction: Inviting viewers to comment, share, or interact with your Shorts can foster a community, enhance engagement, and provide valuable feedback for content improvement.
- Understanding average view duration: Average view duration, or viewer retention, reflects the percentage of your Short watched by viewers. A higher percentage indicates compelling content that keeps viewers engaged.
- Analyze retention for content improvement: Delve into retention data to identify drop-off points. By making necessary adjustments, you can enhance viewer retention, leading to increased watch time and potentially better platform visibility.
One of the most important metrics for YouTube Shorts is ‘Viewed vs. swiped away’ because it’s an important factor for ranking in the Shorts algorithm, so it’s safe to say that this is the most important metric for any creator.
3 tips to improve retention on YouTube Shorts
The retention graph in YouTube Analytics illustrates how viewer engagement fluctuates throughout your Short.
It helps identify the points where viewers are most likely to drop off or continue watching, giving you a precise insight into the strengths and weaknesses of your content.
Here are some strategies for enhancing retention:
- Creating a strong hook: The first few seconds of your Short are crucial. Creating a captivating hook can grab viewers' attention and encourage them to watch till the end.
- Maintaining pace and interest: Keep your content dynamic and the pace steady to maintain the interest of your viewers. Avoid lulls that could lead to viewers swiping away.
- Delivering value quickly: Ensure your content delivers value or entertainment quickly and maintains it throughout the Short, meeting the expectations set by the hook.
Continuously monitor your retention rates and analyze the retention graph to identify areas for improvement. Test different strategies, analyze the results, and refine your approach based on what you learn.
Use your YouTube Shorts analytics to improve performance
Through your analytics, you can discover which YouTube content performs best versus what doesn’t and focus on what does. However, you shouldn’t use data to make all your decisions. Hyper-focusing on data can run the risk of hurting your creativity – which you don't want.
Look at what is performing well and what isn’t, analyze the differences between the two, and apply the lessons to your Shorts marketing strategy.
Try Buffer for free
140,000+ small businesses like yours use Buffer to build their brand on social media every month
Get started nowRelated Articles

Sending ads by mail may seem like a thing of the past, but this marketer thinks it’s a surprisingly effective approach for e-commerce brands.

In this article, we'll explore the unique characteristics of organic and paid social media, how they complement each other, and why incorporating both into your social media strategy is essential for achieving your business goals.

Whether you’re a full-time content creator, micro-influencer, nano-influencer, or just getting started, here’s how to create your own influencer media kit.