Believe it or not, LinkedIn still seems intimidating for most businesses. Why?
Well, the reason is quite obvious. People tend to treat this social media platform as a formal dwelling place for business leaders and legendary brands.
But this is not so! In fact, LinkedIn released a series of updates to encourage budding brands to be active on the platform. The recent boom in video marketing has also made this channel a breeding ground for creators.
Despite this, there is still some hesitancy in sharing light-hearted, informal content. Brands become super conscious and play safe with their LinkedIn marketing strategy in fear that they will lose that professional edge.
But now, you don’t need such assumptions-chief making decisions for you. Data always leads to the best approach; even in this case, you must trust your LinkedIn numbers.
Monitoring your LinkedIn analytics gives you scope to experiment with your go-to strategy. You will get astonishing insights about your audience and end up winning them as leads and improving your social standing.
Without any delay, let’s start with the basics.
Table of Contents
What are LinkedIn analytics?
LinkedIn analytics refers to metrics that tell you how your posts perform on the platform. You will know what kind of content fetches you more engagement and reach.
LinkedIn analytics are super valuable for understanding your audience demographics as well. This is crucial as you’ll get an idea of whether your content is attracting the right audience.
Moreover, employee advocacy is another LinkedIn-specific component that you must monitor for employee-specific engagement and building progressive work culture.
Now that it has become evident that Linkedin analytics can be an essential game-changer for you, let’s proceed on how to access them for free!
How to access LinkedIn analytics for free
LinkedIn offers basic page analytics in its native app. If you are the admin of your company or business page, you will be able to check its analytics.
Here’s how you to access them:

- Log in to your LinkedIn account.
- Tap on the Me icon.
- From the drop-down menu, select the company page whose analytics you want to see.
- Head over to the Analytics option at the top.
- Select the metrics whose details you want to analyze.

If you want a quick overview of your page analytics, you can simply catch a glimpse of it from the right-hand side of the page.

Now that you are well-versed in LinkedIn page analytics, let’s find out what each of these metrics signifies.
Top LinkedIn metrics worth tracking
LinkedIn has already simplified its page analytics. They have grouped their metrics into 6 broad segments.
1. Visitor
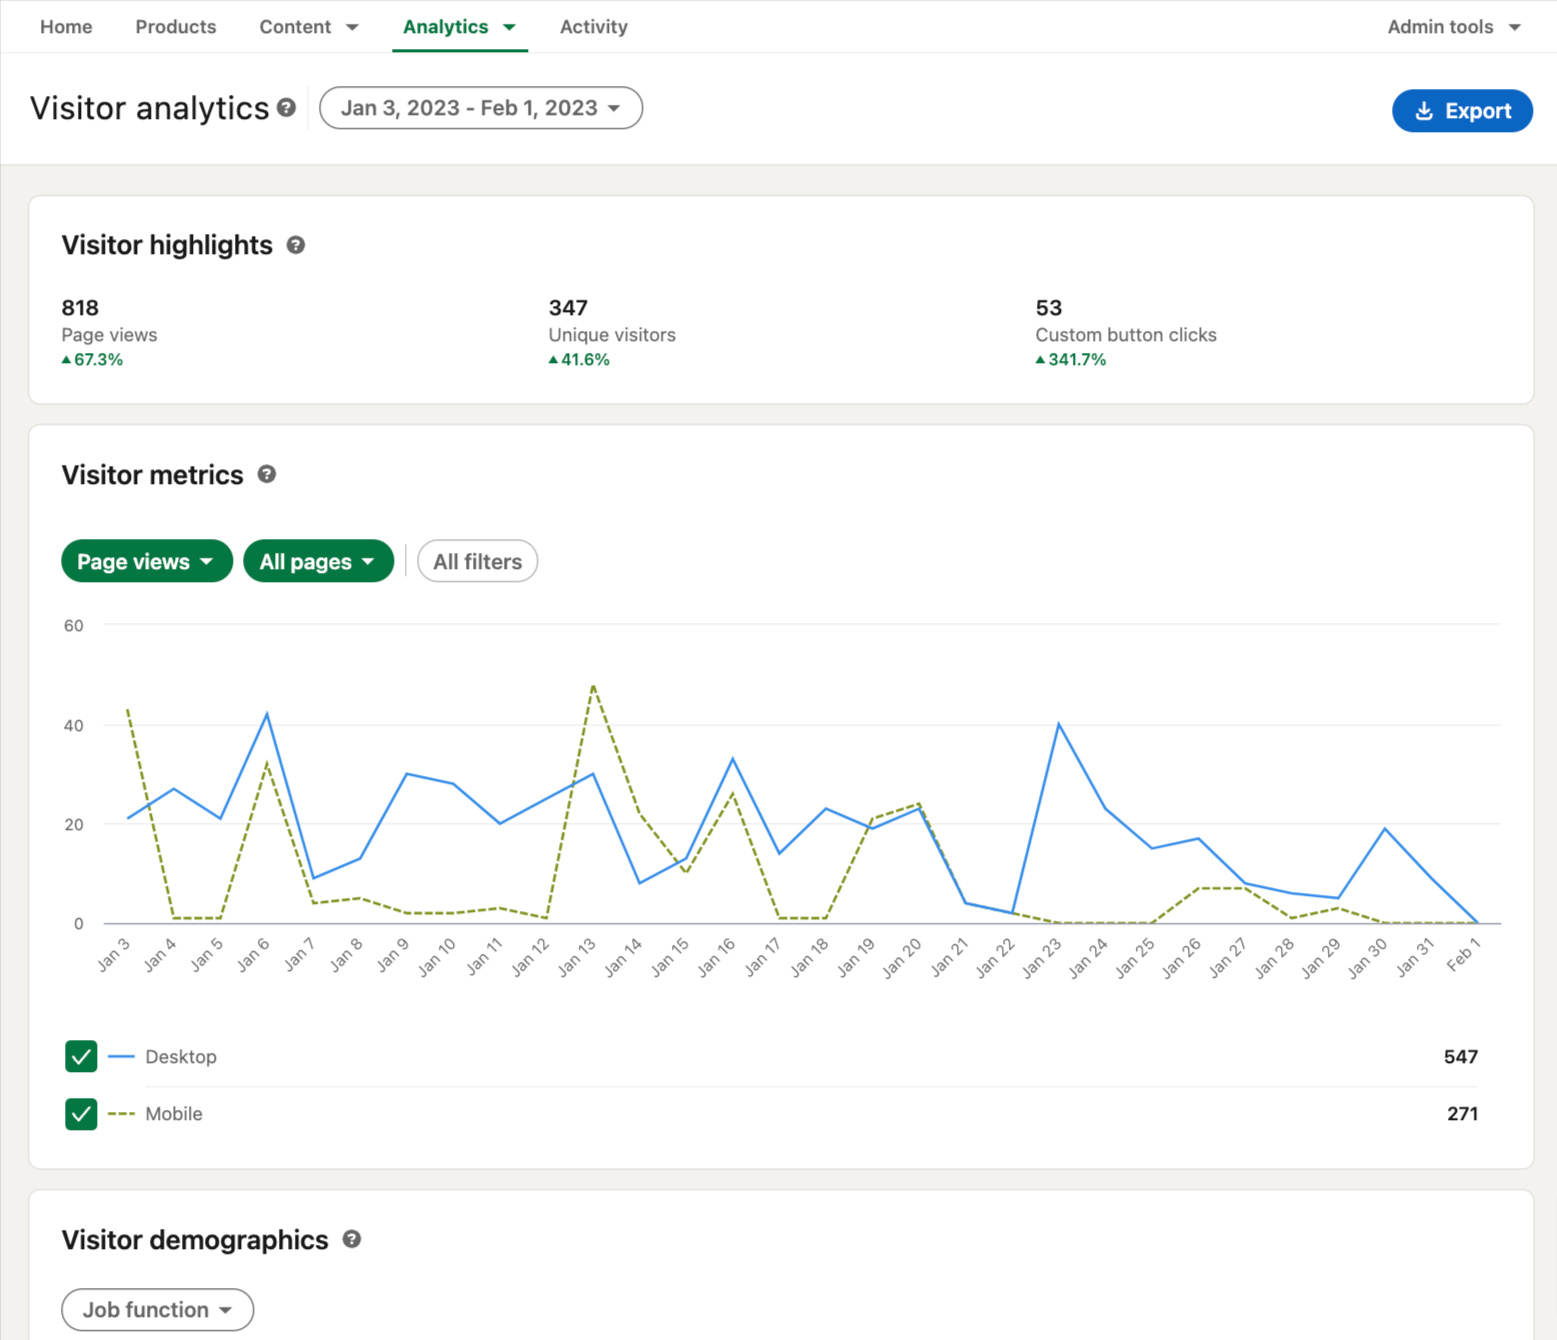
This particular section lists details about your page visitors who aren’t your followers yet. Knowing who they are will definitely aid in gaining more loyal followers, hence eventually converting them into quality leads.
The metrics covered here are:
- Page views: Number of times your page was visited over a duration of time
- Unique visitors: Number of unique users visiting your page over a duration of time
- Custom button clicks: Number of times a button is clicked from your company page post
- Page views via Desktop & Mobile: A detailed graph comparing page views coming from desktop vs. mobile
- Unique visitors via Desktop & Mobile: A detailed graph comparing unique visitors coming from desktop vs. mobile
- Visitor demographics: Details of visitors in terms of job function, company size, industry, location, seniority
Tip: Visitor demographics is the key area that tells you which kind of visitors actually have expressed interest in your posts. If they hail from higher seniority, your posts should follow their tonality while addressing their pain points.
2. Followers

Unlike visitors, followers are a group of people who show an active interest in your business. They want to see more content, posts, and updates from you.
The metrics you’ll see here are:
- Total followers: Number of users following your company page
- New followers: Number of new followers you gained in a duration of time
- Follower metric sponsored vs. organic: A detailed graph showing the number of followers your page gained organically and from sponsored posts
- Follower demographics: Details of followers in terms of job function, company size, industry, location, seniority
Tip: Tracking the number of new followers can determine what actions helped you gain more followers during that period. If the number seems low, it’s easy to figure out what initiatives you need to stop immediately to bring back the rise.
If you manage multiple LinkedIn pages, using a LinkedIn analytics tool like Keyhole is wise. It can help you compare the performance of each page while giving you a data-driven insight into what’s working and what’s not.
3. Leads

LinkedIn is a powerful sales channel. If you run a lead generation form, then this is your go-to place to track leads and conversions from those LinkedIn brand awareness campaigns.
Here are the metrics that you’ll be able to access from here:
- Form location: Specifies the location of the form from where your leads come
- Status: The current status of the lead generation form, whether it’s active or not
- Leads: Number of leads secured
- New: Number of new leads secured in last 30 days
Tip: You can additionally download the details of your leads and check even more analytics like completion rate, cost per lead, conversion rate, etc. This will give you an idea if your ongoing campaigns are successful or need to be tweaked.
4. Content

Though LinkedIn lets you see individual post analytics, this is a section where you can get a brief overview of your overall product marketing strategy. This is a mine for marketers inclined toward content experimentation.
Here are the metrics you can check from this section:
- Reactions: Number of reactions your posts have garnered over a duration of time
- Comments: Number of comments your posts received in a particular duration
- Reposts: Number of times your posts were shared as reposts over a duration of time
- Impressions: Number of users who come across your posts in a fixed duration
- Unique Impressions: Number of unique users that saw your posts over a period of time
- Clicks: Number of clicks you received from your posts
- Engagement rate: A unique metric that is calculated by dividing the number of new followers, clicks, and interactions by the number of impressions
Tip: Yes, you guessed it right! The LinkedIn engagement rate is the top metric you should track for your content-related insights. Plan ways to increase your interactions or clicks with CTA to increase your overall engagement rate.
While the quality of content is a major factor for engagement, it is also crucial when you post it. With Keyhole, you’ll get to know the best time to share your posts for maximum reactions and reposts. You can schedule unlimited posts and get detailed insights about optimal post timings, most engaging post type, top posts, top hashtags, and more.
5. Competitors

One proven way to build brand awareness on LinkedIn is by actively tracking your competitors.
LinkedIn analytics has a dedicated section called competitors, where you can add a list of key players from your industry and track their follower growth.
Just click on Edit competitors and add the company pages you want to monitor. Click on the Save button, and you’ll see the list populating with their information.
Tip: Check out their trending posts from the Competitor page. Notice what content types are fetching the most engagement. Get your dose of inspiration for breakthrough LinkedIn marketing campaigns.
6. Employee advocacy

This section is exclusively for businesses that have their employees on LinkedIn. It shows how employees engage with the recommended posts.
Here are all the metrics available for employee advocacy:
- Recommendations: Number of recommendations made during a period of time
- Posts from recommendations: Number of posts shared from recommendations
- Reactions to posts: Number of reactions received from posts
- Comments on posts: Number of comments received on posts
- Reposts: Number of times posts were shared as reposts
- Employees demographics: Demographic details like location, seniority, and job function of employees who share posts from recommendations
- Demographics of LinkedIn members reached: Demographic details like companies, seniority, industry, job function, and location of users who interacted with employee’s posts from recommendations
- Recommendation engagement: Details related to the recommendations like recommendation title, curated by, date created, posts, impressions, reactions, comments, and reposts
Tip: You can enjoy the number of employee advocacy only if your employees are engaging with recommendations and company posts. Make sure you ask them to actively participate and spark conversations about your business to spread the word.
Bonus: Other Metrics
Apart from page analytics, LinkedIn also allows users to check their posts and profile-specific analytics. Let’s check them out in detail as well.
Profile analytics

These specific analytics pertain to an individual LinkedIn profile. You can track the following data from your profile dashboard:
- Profile views
- Post impressions
- Search appearances
In case you are a premium user, you can access additional data about people visiting and searching for your profile.
Wish to monitor multiple LinkedIn pages at once? Keyhole has got your back.
Just add the pages you want to track, and Keyhole will create a customized dashboard with real-time insights for you. Be it your own business pages or that of your competitors, you can track them in one dashboard.
Post analytics

LinkedIn gives you granular-level details about each post you share from your profile. You can access them directly underneath your posts. Just click on View analytics, and you’ll see the following metrics:
- Impressions
- Reactions
- Comments
- Reposts
- Top demographics
Please note that for most metrics under Page analytics, you can access 15 days to a year’s worth of data. Alternatively, you can also select a custom date range. These metrics can be exported to XLS files as well.
3 Best LinkedIn analytics tools for beginners
The free native tool is great for basic LinkedIn analytics. However, businesses seldom run with one profile and one page. A similar analogy follows for agencies that manage dozens of pages on a daily basis.
LinkedIn analytics tools come to the rescue here. They are third-party tools that let you manage multiple LinkedIn pages. Let’s quickly go through the top 3 tools worth giving a shot at.
1. Keyhole
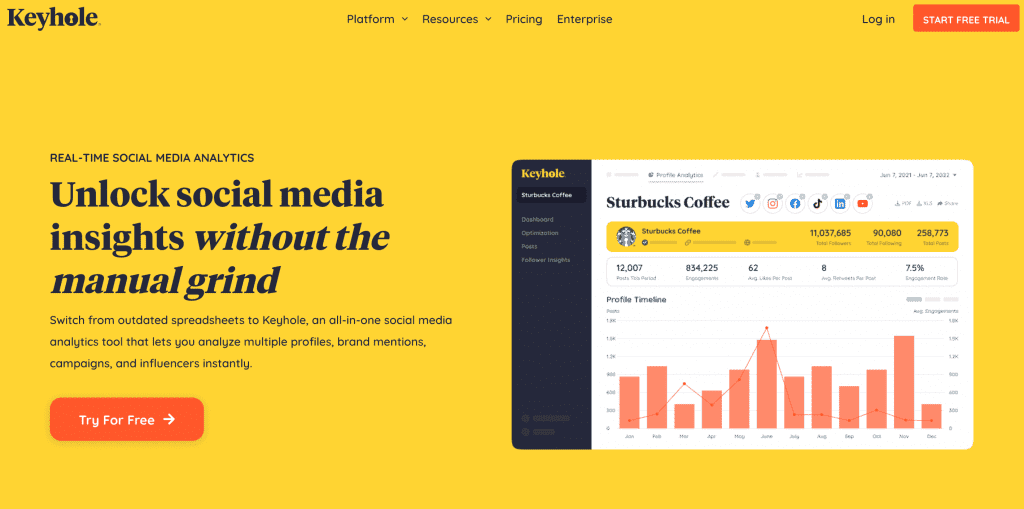
Keyhole is a top-choice LinkedIn analytics tool allowing its users to track multiple business pages. With a negligible learning curve, Keyhole is ready to use from day one.
All you need to do is add your business page, and it will automatically data related to your posts, engagement, and followers at once. The best part about the tool is that it supports top social media platforms like Facebook, Twitter, Instagram, YouTube, and TikTok.
This makes it easy for marketers to access multiple platform analytics in one spot. Plus, the tool offers hashtag and keyword tracking. Some of its amazing features include:
- Suggests the best time to post on LinkedIn
- Provides advanced scheduling capabilities
- Recommends optimal posting length
- Personalized suggestions for profile optimization
- Calculates engagement rate and average engagement per post for LinkedIn
- Tracks brand mentions in real-time
- Analyze sentiments to understand your target audience’s tonality
- Monitors competitors for benchmarking
- Find top-performing posts
- Discover the best content types and media types
- Explore rising trends and patterns in your industry
- Compare the performance of different accounts from multiple platforms at once
- Manage influencer marketing campaigns
- Create custom reports for weekly or monthly KPI insights
“I really do value Keyhole. It’s proven to be highly user-friendly and a pure joy to use. I even use it in my free time.”
-Melissa, Thomson Reuters
“There is no guesswork when you use this tool. There is only top-notch data that you can use to improve your social media marketing strategy.”
-Neil Patel, NPD
2. Inlytics

Inlytics is a LinkedIn-exclusive analytics tool that helps its users optimize their LinkedIn content. The tool is extremely useful in getting analytics for a private profile.
Inlytics analyzes each profile’s data and provides improvement recommendations. It also allows its users to schedule their content at their preferred time.
However, users have complained about its confusing interface. Moreover, if you are active on other social media platforms, you have to purchase another tool to monitor them.
3. Klipfolio
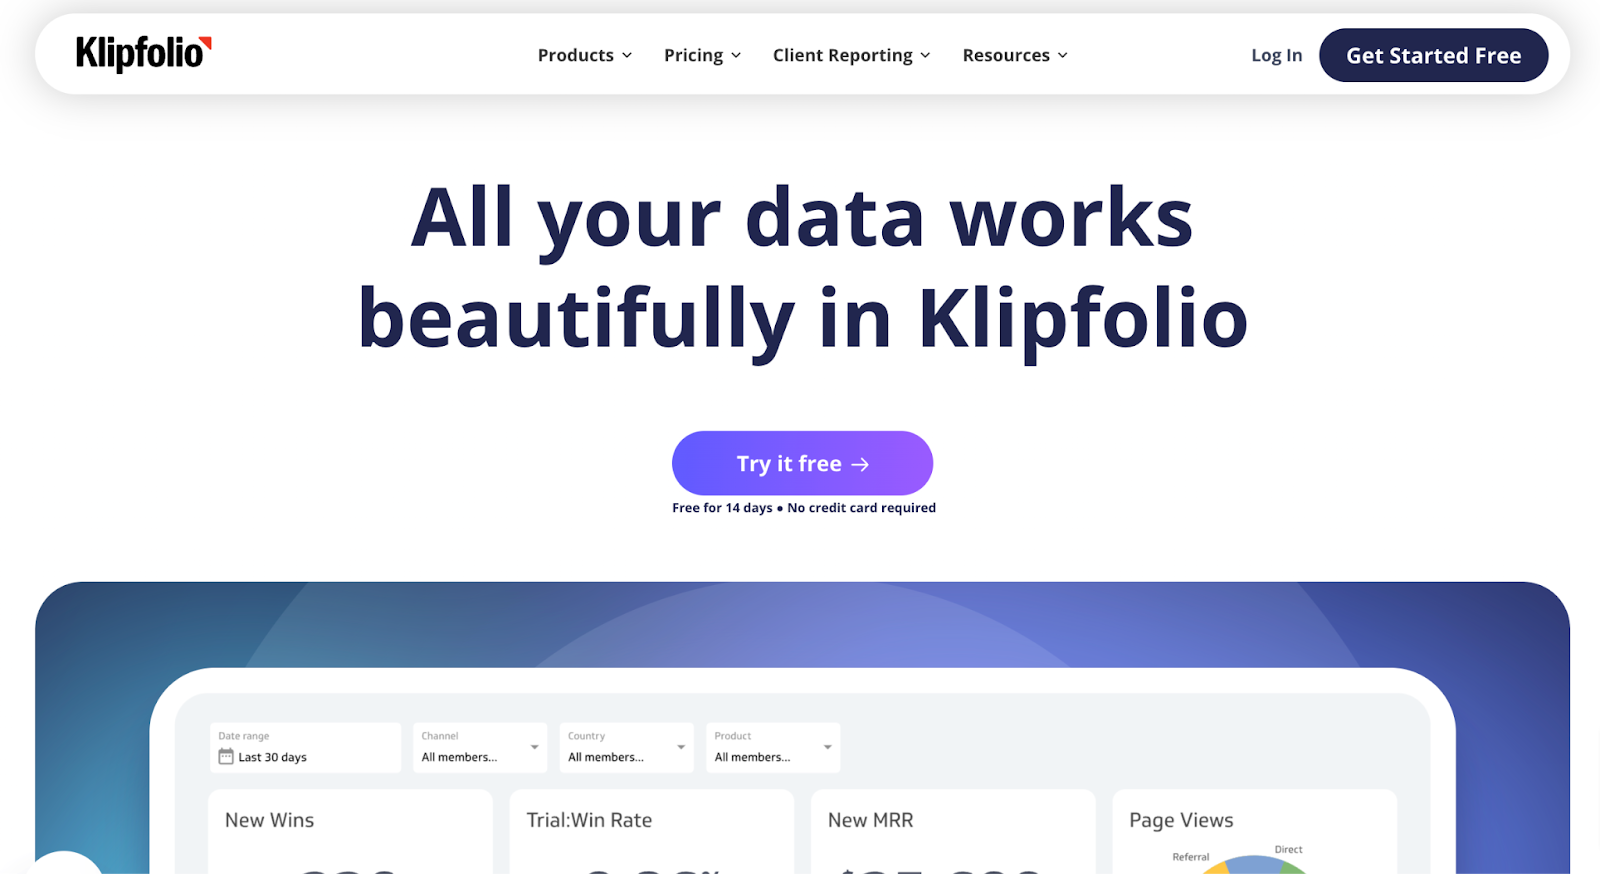
Klipfolio is a social media analytics tool that also offers LinkedIn analytics as part of its offering. The tool lets you create customized dashboards and monitor vital metrics across multiple social media platforms like Facebook, Twitter, and Google Analytics.
However, the tool is extremely difficult to use. Beginners might need some time to be accustomed to creating complex dashboards. It additionally requires a bit of coding background to utilize its full potential.
Final words
More than 80% of B2B sales still happen on LinkedIn. That means you can’t afford to be sneaky in here. The more effort you put into LinkedIn to improve your brand’s reputation, the higher the rewards.
That’s why investing in a good LinkedIn analytics tool will pay off in the long run. Like 100,000+ marketers, you can reap the benefits of Keyhole too. Whether you are an agency or managing a global brand, Keyhole can help you automate your everyday marketing drills in a shot.
Start your free trial to get started now.
Frequently Asked Questions
1. Which LinkedIn analytics tool is the best?
Keyhole is one of the best LinkedIn analytics tools that lets you manage multiple LinkedIn pages in a dashboard. It provides in-depth and advanced tracking capabilities that help in monitoring brand mentions, relevant hashtags & keywords, and even competitors.
2. How is LinkedIn analytics used?
LinkedIn analytics refers to a set of metrics that tell you how your posts are performing on the platform. You will get to know what kind of content fetches you more engagement and reach.
3. What is the most important analytics in LinkedIn?
LinkedIn's most important analytics are those related to follower demographics and engagement. These two metrics are vital in determining the effectiveness of ongoing LinkedIn marketing strategies.