

This is a guest blog written by Beatriz Montenegro, Research Analyst at Twitter Brazil. Beatriz studied economics and has been part of the Market Insights & Analytics team at Twitter over the past 5+ years. She believes research is more about questions than answers. Connect with her on Twitter and LinkedIn.
Twitter has been around for 13+ years, and although it’s format and character count evolved, its identity remained grounded on the same aspects: horizontal, real time, culturally effervescent. That steaming pot of people and conversation is very inviting for researchers of all shapes and sizes.
This data is one of many inputs for social listening and audience segmentation analysis. The open nature of the platform allows it to be a great source of public conversation. Most market researchers will be familiar with some of the tools that give us access to this sort of information: BrandWatch, Affinio, Audiense, Sprinklr to name a few.
.png?width=300&name=Disen%CC%83o%20sin%20ti%CC%81tulo%20(15).png) I’ve worked with almost exclusively Twitter data for 5 years now, and today I want to offer a couple of points of views I like to adopt when I’m analysing on the platform. There are as many possibilities as there are people trying to analyse those chunks of conversation and user data, so I’m merely sharing some of the angles I like best.
I’ve worked with almost exclusively Twitter data for 5 years now, and today I want to offer a couple of points of views I like to adopt when I’m analysing on the platform. There are as many possibilities as there are people trying to analyse those chunks of conversation and user data, so I’m merely sharing some of the angles I like best.
It’s less about the tools, processes and technical aspects of it, and more on where some points of view have taken me. Those have grounded some of my favorite internal and external strategies and stories. A couple of verbs that translate my angle when I use Twitter as a starting point.
Flocking - One is likely to be around others like them
It doesn’t matter which app store or gallery your native to, if you search for Twitter on them right now you will find out (if you don’t already know) that the platform is registered under news applications, not social media. That brand positioning derived from audience behavior, and explains a whole lot about the flocking quality we can observe on it.
When setting up an account and deciding who to follow, it’s most likely the average person will follow users representing their interests - music, TV, news, politics - and not necessarily friends or acquaintances from real life. The #1 reason to be on Twitter, according to people on it, is to follow the news and conversation around topics of interest.
On the risk of sounding obvious, since there are a lot of already mentioned tools of clusterization that feed on this information, Twitter audiences tend to flock to particular interests and topics. What’s interesting though is that we discovered in a study done in the UK that even when people are not discussing their particular common passion point, they still tend to consume information and conversation from the same group. Flocking starts drived by a passion point, and continues on even if the subject will sometimes vary.
Flocks and communities might be united by a single theme, but still tend to band together with some other conversations.
So what?
Flocks tend to have specific behavior, which stands out the more when you’re looking at a niche. When we are talking about K-Pop, for example, I can tell you it’s the biggest conversation about a music genre globally - in August 2020 it was almost 8 times bigger than pop, the second contender. However, when we examine the actual number of people talking, K-Pop averages on roughly 57 Tweets per author while pop rounds up to only 7 Tweets. There were more people tweeting on pop music, but they are not nearly as engaged as K-Pop fans.
When we took a qualitative look at it, a good amount of people talking about K-Pop in Brazil specifically had an exclusive account for the content. With a survey we confirmed that almost half of people interested in the genre had an account dedicated to it (almost 2.5X times pop fans).
This pattern of behavior - super organized and engaged fandom - repeats itself on some other topics and themes. We can even try to build a scale from mainstream-topics-everyone-will-drop-their-two-cents to a highly engaged niche and see flocks behaving with patterns.
The point of view I’m offering here is that Twitter data can show us how people behave when they can be immersed in their interests. How that relationship will affect what they consume and what they put online. If you’re tasked with understanding a particular audience with a passion, chances are Twitter data is a good starting point.
Shifting - Behaviors & Trends in between the lines
The next verb I’m sharing today is shifting.
Twitter’s public nature allows conversation analysis to go in rather deeply, with a complete view of what’s being talked about. There are a number of ways we can take a snapshot of a subject and analyse it through Tweet volume, sentiment, etc. A very interesting twist when we’re talking about broader themes and long term is observing shifts.
I have two examples to illustrate. In 2018, I was hit with a very broad briefing about street art. I did a number of breakouts and filters to grasp the overall conversation, but my favorite slice of information was the evolution through time of the discussion regarding graffiti vs. pixação (Portuguese word for marginal and outcast street art and expression - graffiti is art and pixação is vandalism).
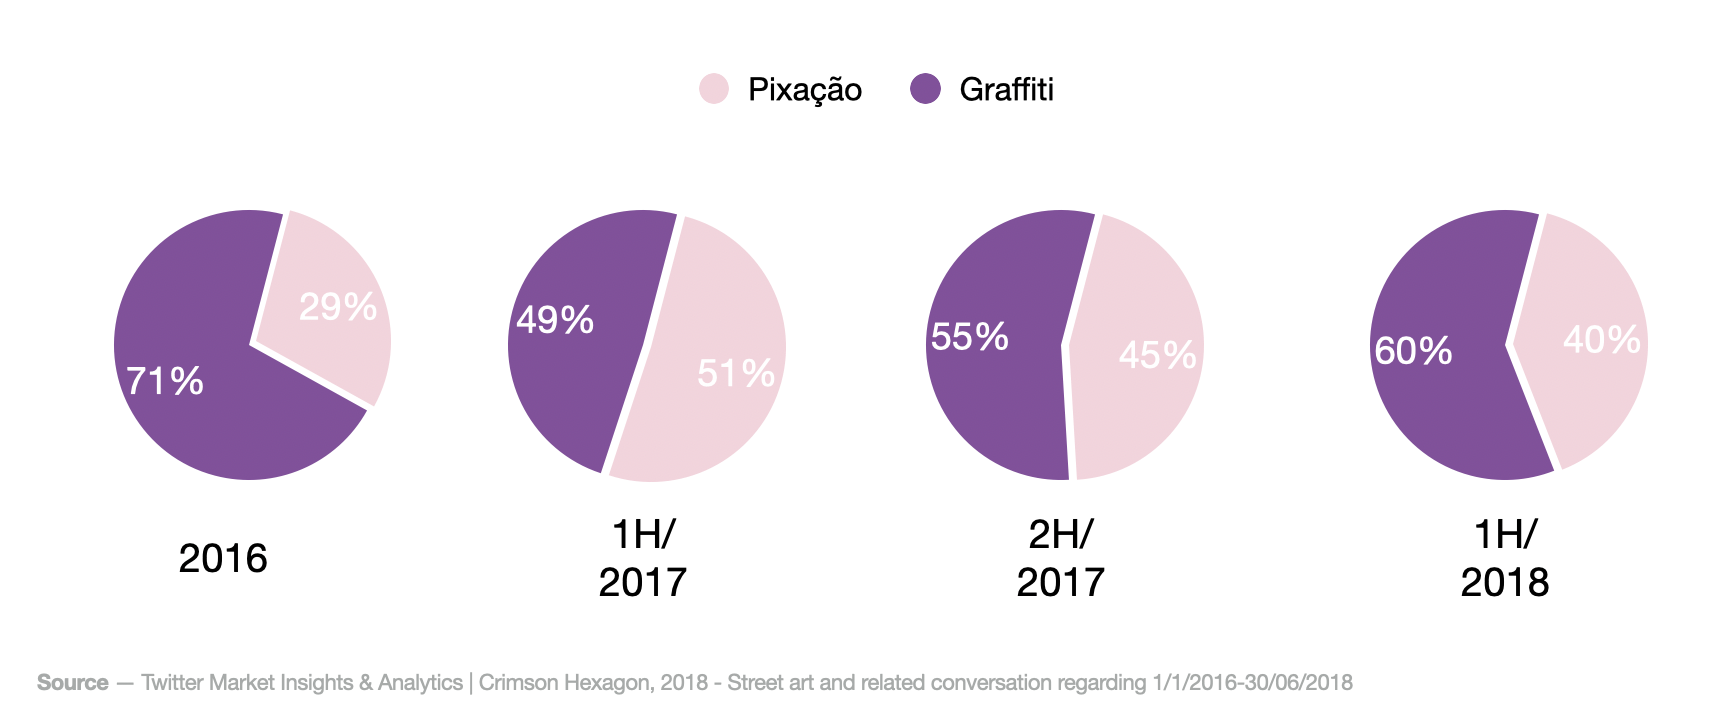
By the end of 2016, São Paulo went through a very controversial intervention called “Beautiful City” (loose translation). It brought up the debate about expression and freedom, about true art, among other things. This heated up conversation so much it shifted its behavior for at least one and a half years. One of the takeaways was that we can’t pretend this does not exist if a brand wants to speak about street art.
That’s a shy example compared to the next one: last year Twitter launched Culture Insight through conversation, which is a massive work done with internal teams and outside vendors to crunch 3 years of conversation data into overall trends. Detecting major increases in hashtag usage and grouping some behaviors resulted in this view of what has changed, and what might carry on to the future.
If something is shifting, there should be a reason why. Twitter data might be the first step into identifying some of those changes.
Twitter data as a starting point
Shifts and flocks are just a few of the many behaviors that can be observed and studied with Twitter data. I’m calling it a “starting point” because digging on such a vast and public amount of information is a great way of getting context and forming hypotheses to test on later. Sometimes all we need is that first step to help us grasp what we are looking at.
Audiense is committed to having a more diverse and inclusive selection of contributors and industry thought leaders in our articles. If you’re interested in collaborating with us, please email leticia@audiense.com and include your specialist areas of expertise, and/or preferred subjects for commentary.
Header image by Daniele Levis Pelusi on Unsplash.