How can you tell whether your hard work on Twitter is worth it? You’ll have to dig into Twitter stats to find out. Here’s how.
Social media managers and marketers need social media stats.
Without them, we don’t know whether our time on social networks is well spent, if our strategies are working, and if we are reaching the right people.
So when Twitter removed Audience Insights, I was flummoxed.
More than anything, we need to know we are building an audience of the right people— those who will become our customers and the people who influence them.
What Was Wrong with Existing Twitter Stats?
The Twitter audience insights stats were always thin. You could see gender, location, and some spurious categorizations like “lifestyle” and “consumer behavior.” But they never made as much sense as the stats we are used to seeing on Facebook.
Twitter’s Interests section always seemed off-kilter. At one stage, everyone in Ireland’s followers had the top interest of “dogs,” including me—and everyone knows I love cats.
Samantha Kelly (@Tweetinggoddess) tweeted about it, and most responses she got said yes, the subject “dogs” was either the top interest or in the top three.
Ok Twitter folks…..am curious…..go into your analytics. Go to audience…..does it say 'dogs' at the top of your audience interests? pic.twitter.com/FHZViCChiy
— Samantha Kelly (@Tweetinggoddess) December 11, 2018
It looks those “audience” statistics weren’t always accurate. Could this be why they removed them?
Just before Twitter took these stats away, it gave us something new.
Conversation Insights and Audience Insights
These statistics hidden away in Twitter Media Studio don’t replace the demographic information, but they do give us more data about the mentions we get on Twitter.
Let’s start by looking at Conversation Insights.
Where Do You Find Conversation Insights?
You’ll need an ad account, even if you don’t run ads, and 1,000 followers to access conversation Insights.
Go to studio.twitter.com and click the “Insights” tab, select “Conversations” from the drop-down menu.
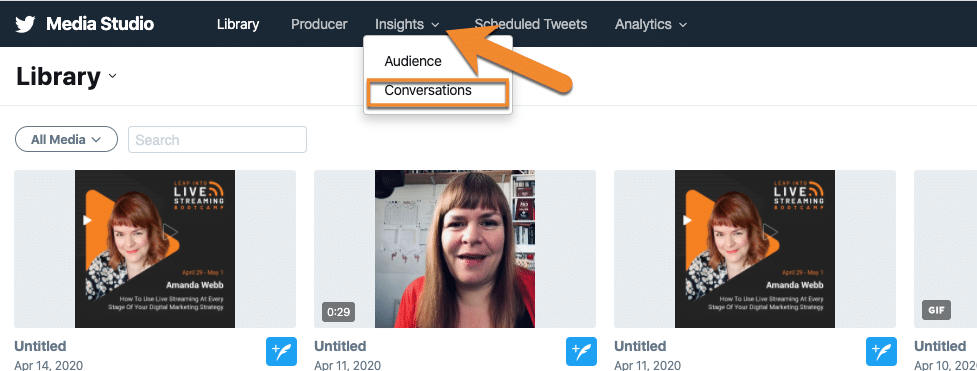
Conversation Insights are found in Twitter Media Studio
Now that you are in
The dashboard displays your mentions for the last day broken down by hour. The graph at the top is interactive. Click on a column—and it will expand to show you information about that specific timeframe.
Click on a column in the graph to find insights about a specific day, hour or minute
This feature becomes more useful when you view a larger time period.
To change the timeframe, click on “Today,” and select the time period you want to analyze.
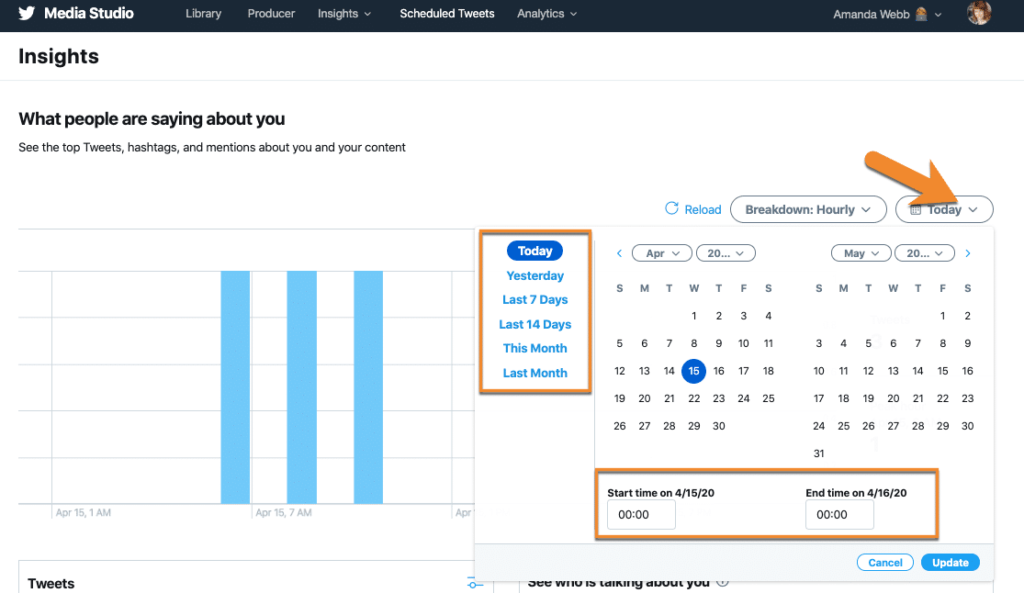
Select the timeframe you want to analyze
If there is a lot of engagement on the account you manage, you can break down your mentions by the minute.
Just like with the bigger graph, you can get more insights on a specific day, hour, or minute. Click the column related to it. This is useful for getting information about the peaks in your mentions.
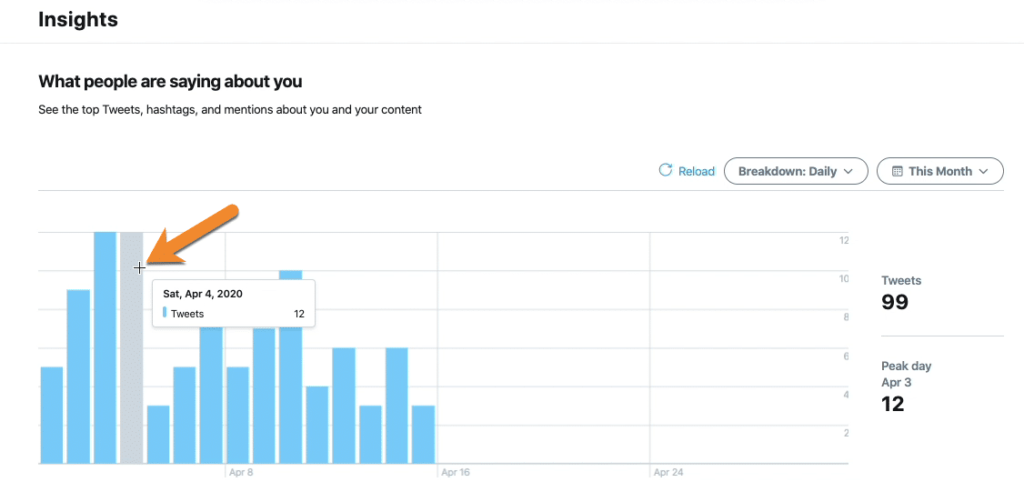
Hover over a column to see the number of tweets. Click it for more insights
Scroll down … and you get an overview of the top tweets and mentions from your selected time period and a list of the most influential people in conversations with or about you.
This is a useful way to analyze mentions and make sure that the influential people you are connecting with are the right fit for your audience.
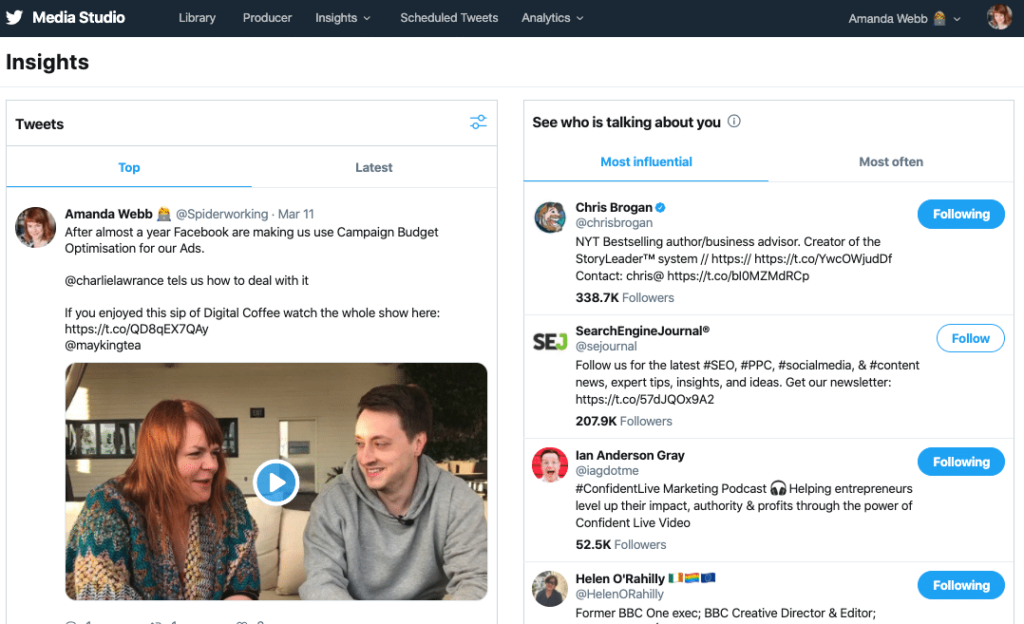
Twitter conversations show you mentions and more about the people who mention you
You can filter your Twitter mentions by the author (verified vs. non-verified), tweet/retweets/tweets & retweets, and format.
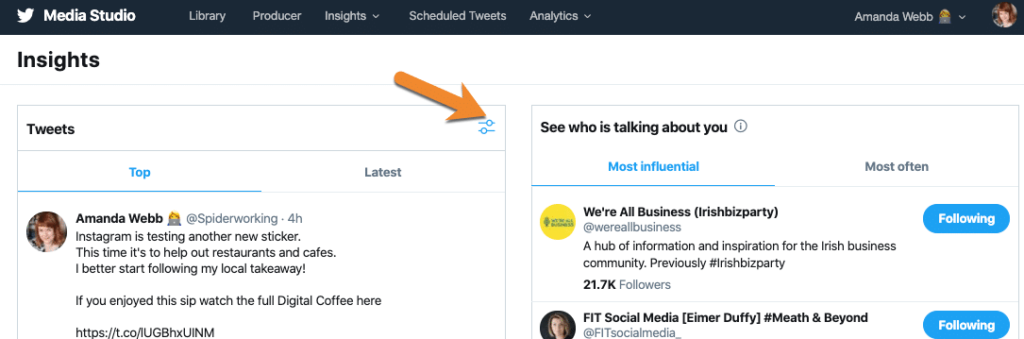
Filter conversation insights
I like the format filter. It’s a good way to see which videos, images, links, and text-only tweets are getting the most engagement.
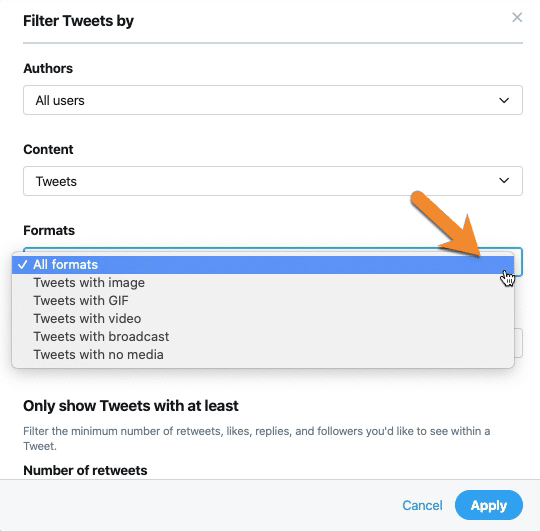
Filter tweets by format to analyze media performance
You can also filter the “See who is talking about you” section by “influential” or “most often.”
The “most often” filter will help you find the people who could be more powerful than the influencers, your fans, the people who chat with you, and share your stuff the most.
Twitter conversation insights give you some useful information. They’ll help you identify popular content, influencers, and fans who spread the word about your business—but they don’t give you that demographic data on your audience that Twitter took away.
Let’s look at that “Audience’” section to see whether those Twitter stats are revealing.
Twitter Audience Insights
You’ll find this under the same tab as your conversation insights.
I was disappointed when I clicked. There’s just one screen of data. It shows you when your followers are watching video on Twitter.
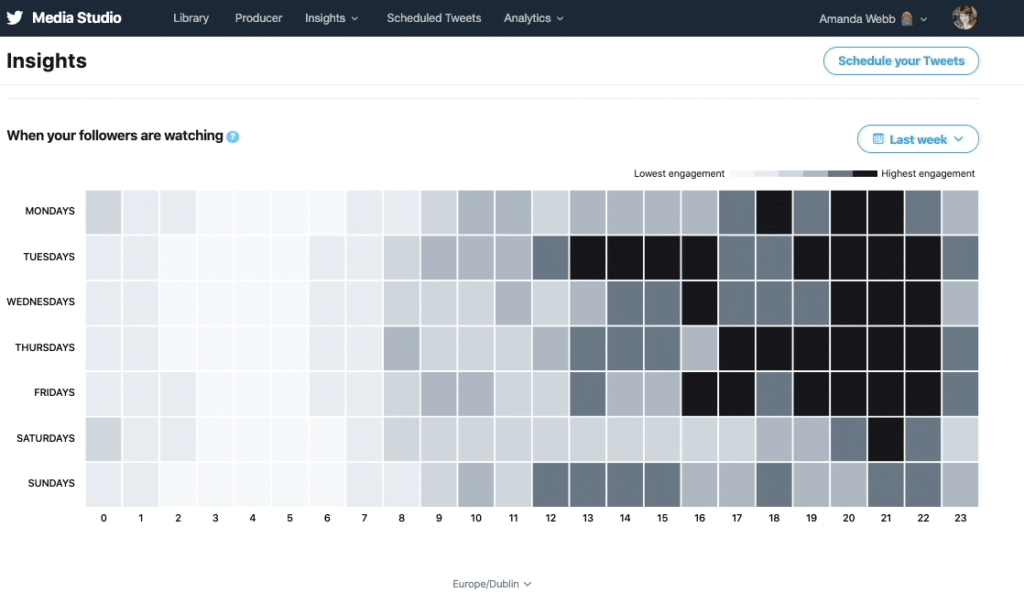
Twitter audience insights only show you the best time to post video content
There are some filters. You can select a timeframe and a region.
Although this screen is about video, you could use it to make some guesses about when to post other Twitter content.
Video viewers have more time to consume than the fleeting scroller that we see at other times of the day. Using the Audience Insights data, we can grab their attention at the times they are online viewing videos. If they are paying attention to video content, they also have time to get into conversations and even read articles you link to.
You can schedule tweets with media attached from the audience insights interface too, which saves time switching from insights to another tool.
These insights are nice to have but now our Twitter analytics are split over two areas, it makes finding metrics and measurement more cumbersome.
Agorapulse users can save time with reports …
Agorapulse Reports
Agorapulse reports, available to all users, are easy to grab and visualize your Twitter stats in one place.
To find your reports, click on a Twitter account from your Agorapulse dashboard and select the “Reports” button.
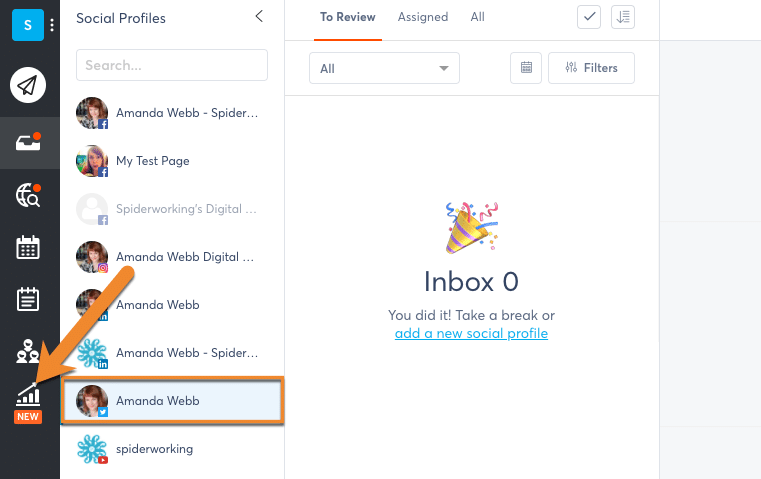
Use Agorapulse reports to get insights on your Twitter account
Just like on Twitter, you can analyze data for a specific timeframe.
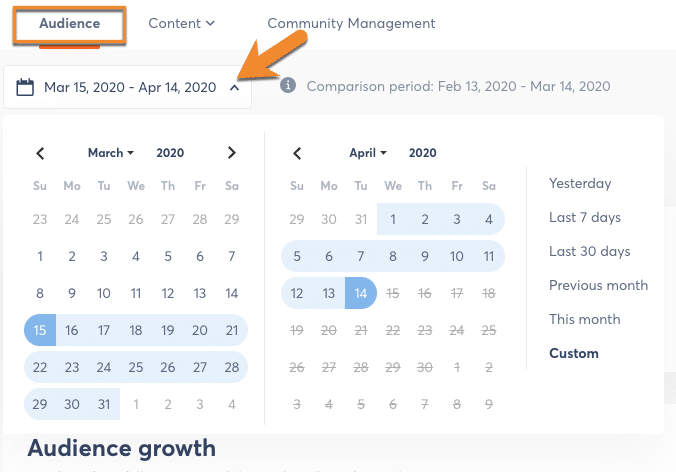
Select the time frame that you want to analyze tweets from
Scroll down and to the “User Activity” chart. This is like Twitter’s audience insights. It shows you what days and times users interacted with your content the most. That’s all your content, not just video.
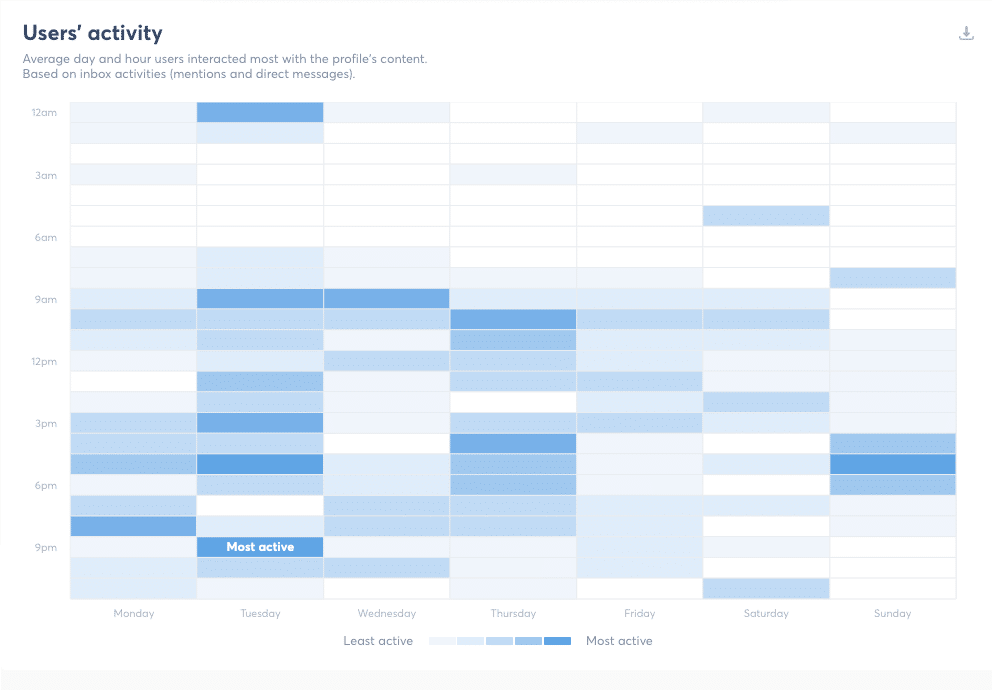
The user activity report tells you when your audience interacts with you the most.
Below that, “Brand awareness” totals up not just your mentions but any search terms and websites you have added to your monitoring on Twitter.
It’s a quick way to see how many conversations you’ve sparked or been involved with, even if they haven’t @mentioned you. The example below includes my website mentions alongside regular mentions.
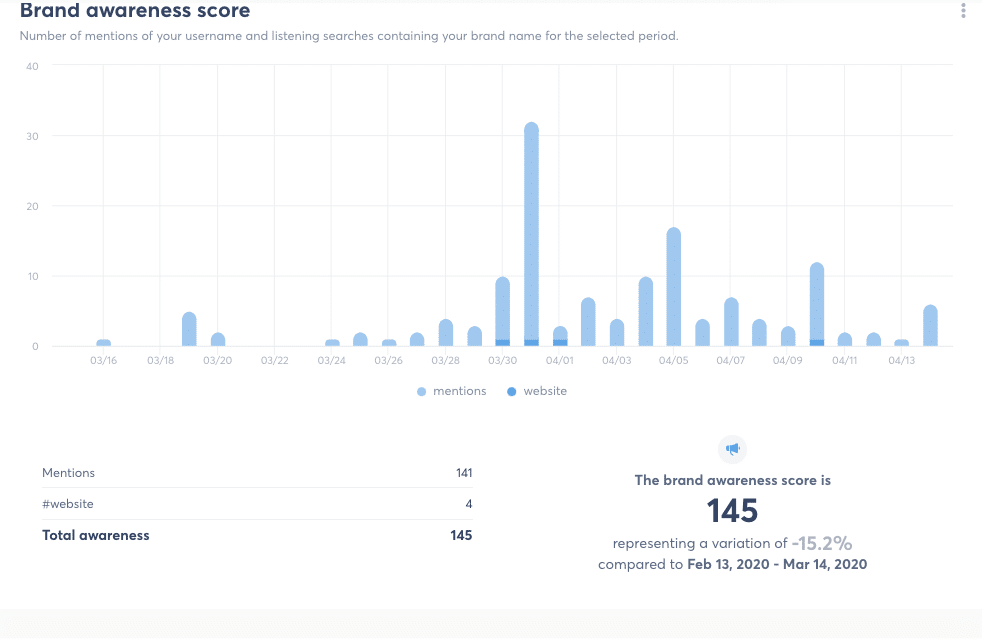
Brand awareness tells you how much people are talking about you even if they don’t mention you.
Click into “Content” in the top bar and “Performance” from the drop-down to see a list of your tweets.
Filter these by:
- Likes
- Retweets
- Engagement
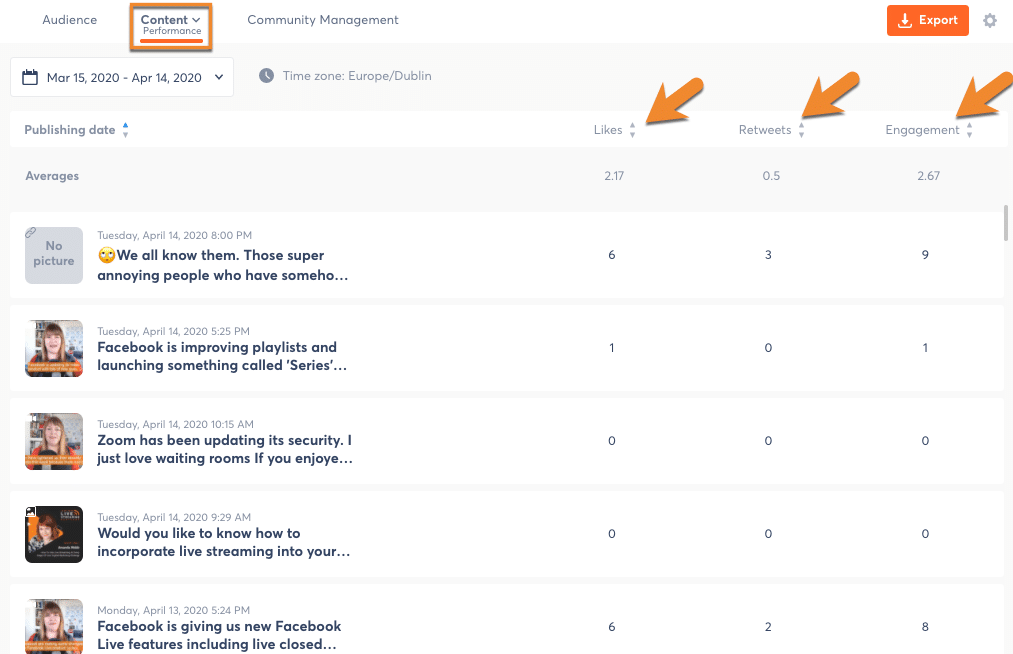
Evaluate your tweet performance
The best information is found under “Content” and “Global.”
Here, you’ll see the best time to post and the best type of content to post based on previous engagement. It looks like I need to post more media and fewer links.
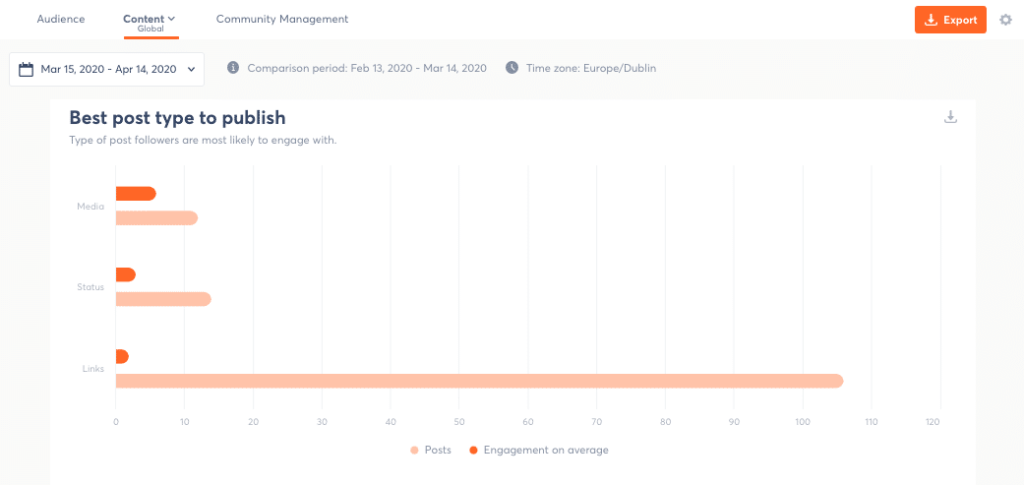
Find out what sort of tweets get the most engagement
I love that all this information is in one place and quick to navigate, but what about the people who engage with our content on Twitter?
There is one way you can find out some information about them.
Google Analytics
If you can’t find the demographic information about your entire Twitter audience, if you could choose just one segment of your audience to analyze what segment would you choose?
If you said “website visitors,” you’re in luck.
When someone clicks a link on Twitter and lands on your website, the person is a stronger prospect than someone who just watches a video or clicks like on a tweet.
When installed on your website, Google Analytics can tell you some demographic information about these people. If they fit your customer profile, it’s clear that Twitter is still worthwhile for you. If they subscribe to your list or buy as a result, even better.
How do we track those Twitter stats?
Create a custom report in Google Analytics
First, you need to set up a report to filter data to just those people who visit your website from Twitter.
From your Google Analytics dashboard, select “Customisation” and then “Custom Reports” from the left-hand toolbar.
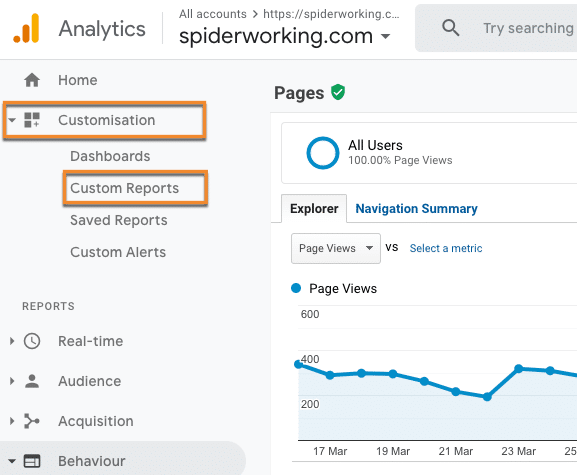
Create a custom report in Google Analytics to find out more about your Twitter visitors
Click “New Custom Report” and give it a name.
Under “Metric Group,” select “sessions.”
Under “Dimension Drilldown,” select “social network.”
Under “Filters,” select “Social network” exact ‘Twitter.” (Be sure to capitalize Twitter or you won’t get any results).
Here’s what your report set up should look like:
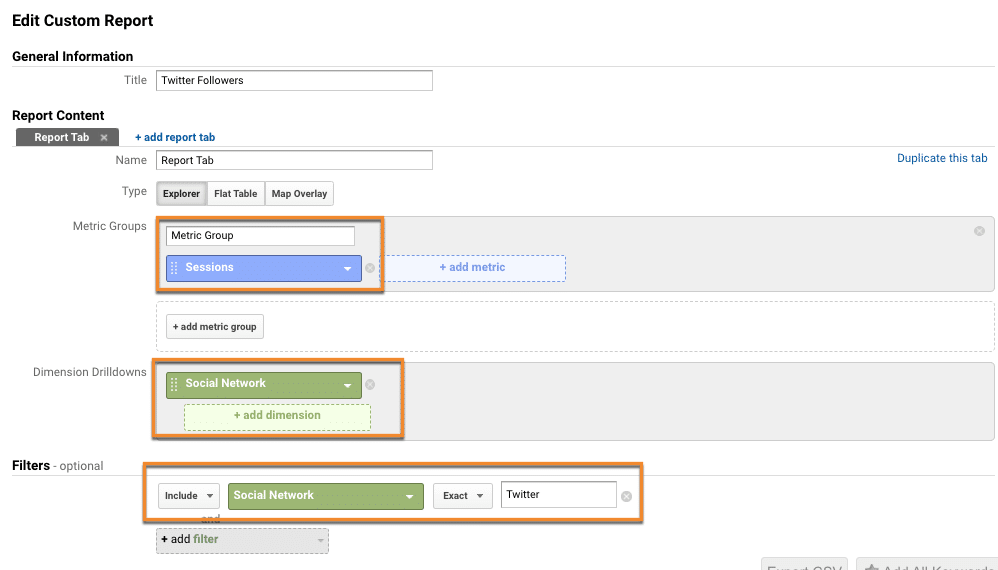
Layout of a custom report to get data on visitors from Twitter
This report will show you how many website visits you are getting from Twitter. If you want to find out more about those visitors use the “secondary dimension” feature.
Click on the “Secondary Dimension” tab, and select users from the drop-down menu. From here you can select age, gender, country, or city among other metrics.
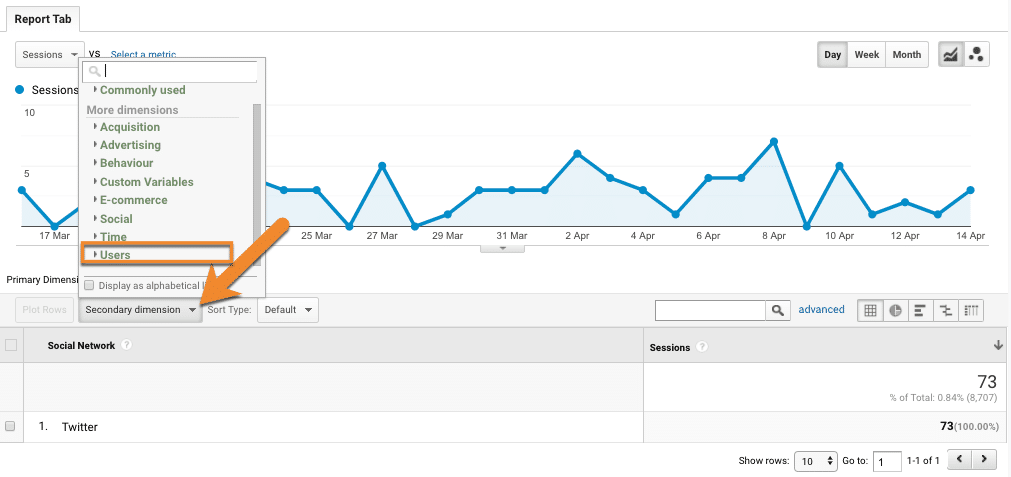
Select the information you want to see from the ‘Secondary Dimension’ menu
I’ve selected “Country,” I’m in luck. The three countries that top the list are three of the countries I target customers in.
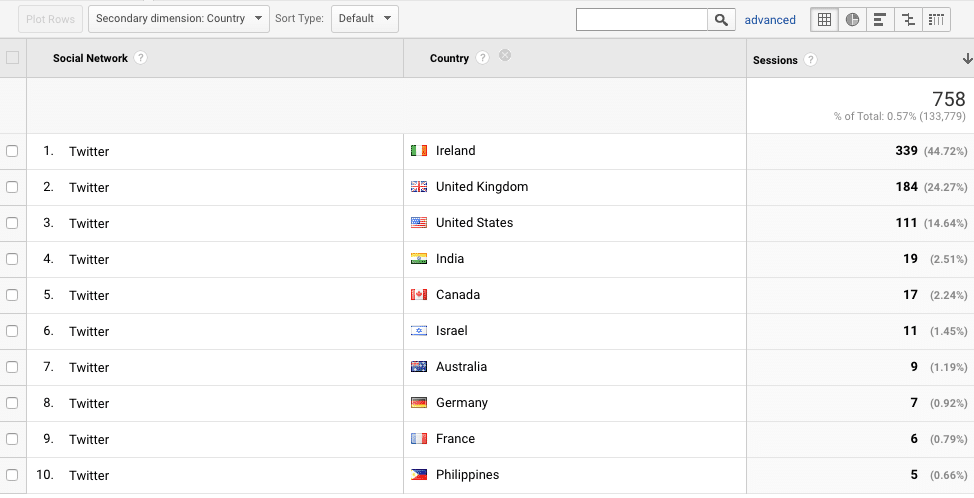
See the top countries, cities, age groups and genders for your Twitter clickers
Repeat this process for age and gender. Analytics aren’t as skillful at picking out these demographics, but if you look at a large time period, you will get some data.
What Should We Look at Instead of Demographics?
We’ve looked at a lot of data here. We can no longer identify the demographics of our Twitter audience, so what other metrics should we be looking at instead?
We should keep a record of this information:
- When to post to get the most engagement. This is a wonderful starting point for scheduling tweets at the right time.
- Are we engaging with the right influencers? Twitter Conversation Insights can show us who is helping us reach a broader audience and whether they are a good fit for our business.
- What content types resonate the best with our audience.
- What links drive clicks to our website?
- Who clicks your links on Twitter?
In Conclusion
I think it’s probable that Twitter closed audience insights because they knew they were inaccurate. If that was the case, they made the right decision.
I’m hoping that the new conversation and audience insights will expand to give us more detail about our followers and the people who engage with our content.
But if that doesn’t happen, the new statistics, paired with Agorapulse reporting and Google Analytics, tell us enough.
Twitter may be well behind Facebook in being able to tell us about our followers and the people who engage with our content. Let’s hope this improves in the future.
Sign up now for a FREE demo.