
How to analyze Twitter data

Written by Alex York
Published on December 10, 2020
Reading time 8 minutes

With a 280-character limit, it’s easy to think of Twitter (rebranded as “X”) as a basic platform. But the fact of the matter is numerous marketers see success in their social media marketing strategies by paying closer attention to Twitter analytics.
Whether it’s Tweets, impressions, engagements or clicks, there are several metrics that give you additional insights into how well you’re resonating with your audience. A common problem for companies is they don’t know the best route to take when analyzing Twitter data. This means brands have no idea why a piece of content did extremely well or fell flat.
Looking into the data not only shows you what was working, but it gives you more insights to be successful on your next campaign. That’s why brands are increasingly turning to social data as a key source of business intelligence to help drive marketing decisions and provide crucial insights across the organization.
Understanding how to analyze Twitter data thoroughly helps keep your brand out of the dark. Collecting data shows you how a campaign performed and the trends to follow in the future.
What Is Twitter Data?
Twitter data is the information collected by either the user, the access point, what’s in the post and how users view or use your post. While this might sound somewhat vague, it’s largely due to the massive amount of data that can be collected from a single Tweet.
With this information, you can know demographics, total clicks on your profile or how many people saw your Tweet. This is just the tip of the iceberg, but understanding the data allows you to know how it’s used and the patterns of your content.
How to Measure Twitter Data
Measuring your Twitter data can be done through different avenues. Depending how robust you want your analytics, there are diverse options to give you oversight or in-depth analysis. In this article, we’ll talk about the two ways we recommend pulling and measuring your Twitter data:
Using Twitter Analytics
Twitter’s built-in analytics tool gives you access to additional data beyond shares, likes and Retweets. Over the past few years, Twitter continues to improve its analytic features for advertisers, marketers and the general public.
This makes it easier for businesses working on a tight social media budget, but need the data for upcoming campaigns. According to eMarketer, roughly 66% of businesses use Twitter for marketing efforts. The agency shows this number is only expected to grow over the next few years, which means Twitter will continue to put emphasis on analytics.
As of now, Twitter breaks up your analytics into five main sections:
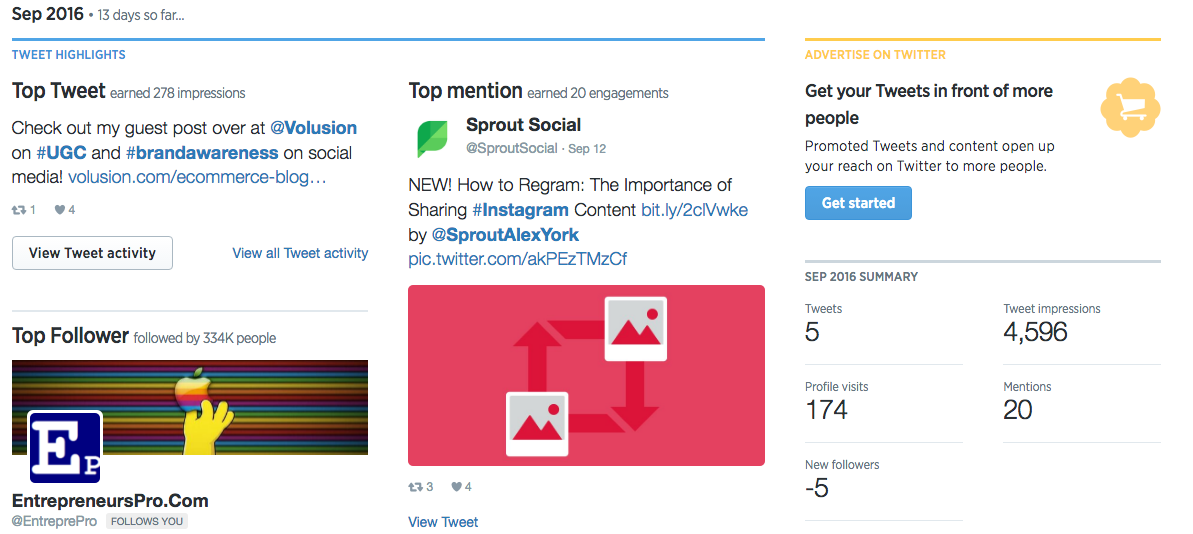
1. Account Home
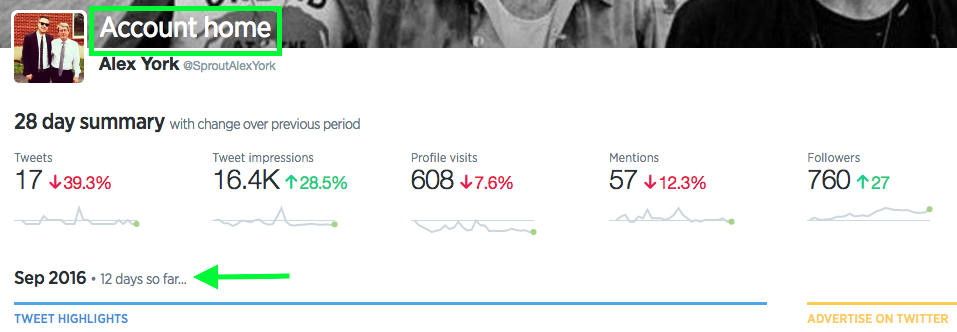
Twitter provides a robust monthly review for users to see the performance of their content. Some of the data you can see from the home section includes:
- Tweets: Total number of Tweets you sent.
- Tweet impressions: Total number of times a user was served your Tweet in their timeline or search results (including whether it was seen or not).
- Profile visits: Total number of times your profile was clicked on from your Tweets or through search.
- Mentions: Total number of times your Twitter handle has been used in other users’ Tweets.
- Followers: Total number of followers, plus how many new followers you’ve gained since the previous period.
These metrics do a great job at showing traffic, views and trends. Straight from your Twitter Analytics dashboard, you can see month-to-month trends with the collected Twitter data.
2. Tweet Activity
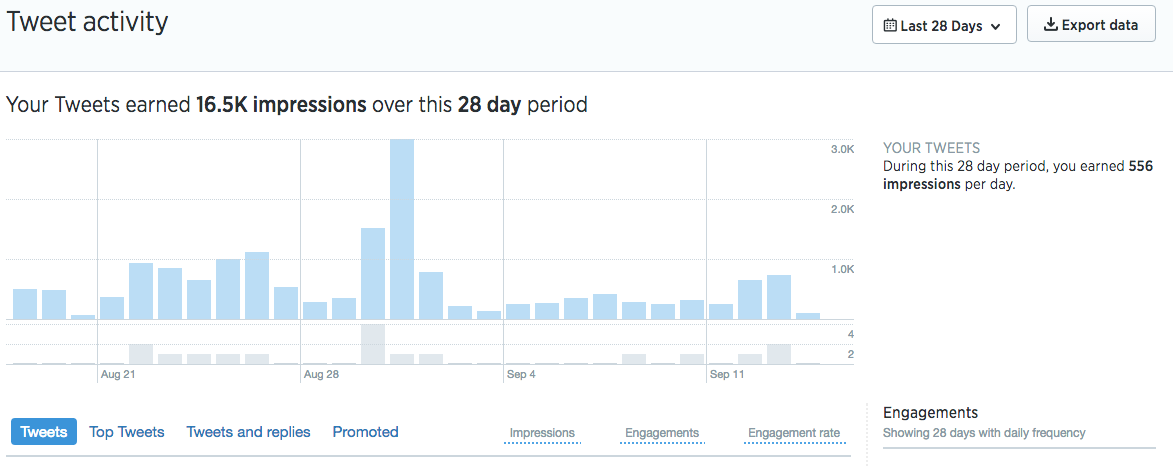
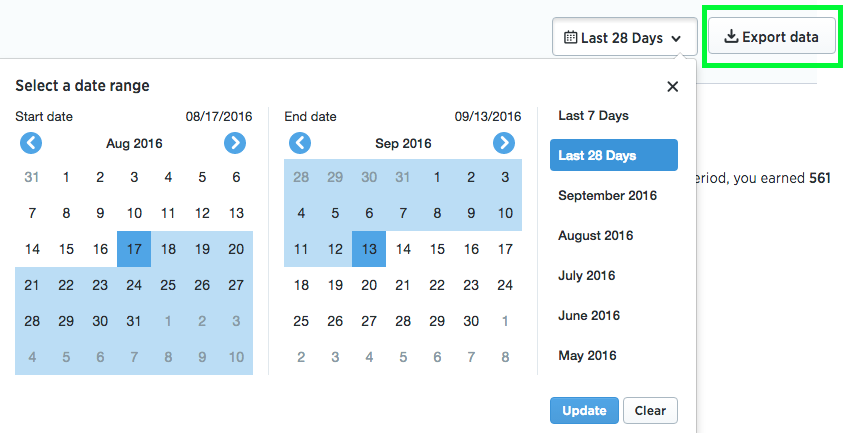
Tweet activity gives you a broad view of the number of Tweets and organic impressions (not including promoted impressions) for a specific day or time period. Through the Tweets section, you can also export the data from your Twitter profile to a CSV file and choose your specific timeframe.
Make sure you always track and monitor this information in some sort of spreadsheet to better see trends and significant changes. Additionally, you can view your top, promoted, replied or all Tweets from your profile. Once you select a view, you see the specific Twitter data associated with each Tweet. These metrics include:
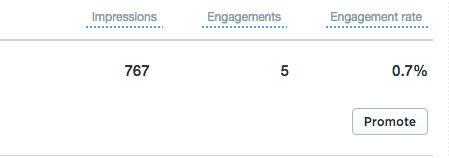
- Impressions
- Engagements
- Engagement rate (total engagements divided by impressions)
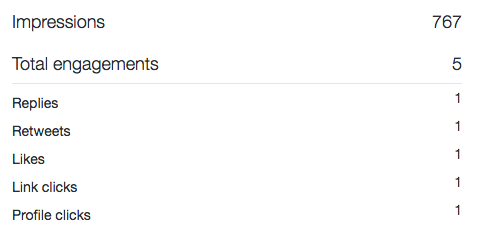
Clicking on “View Tweet Activity” on an individual Tweet you can get more details on the types of engagement you received. You’ll see metrics such as replies, Retweets, profile clicks and others depending on the type of content you’re sharing:
3. Audience Insights
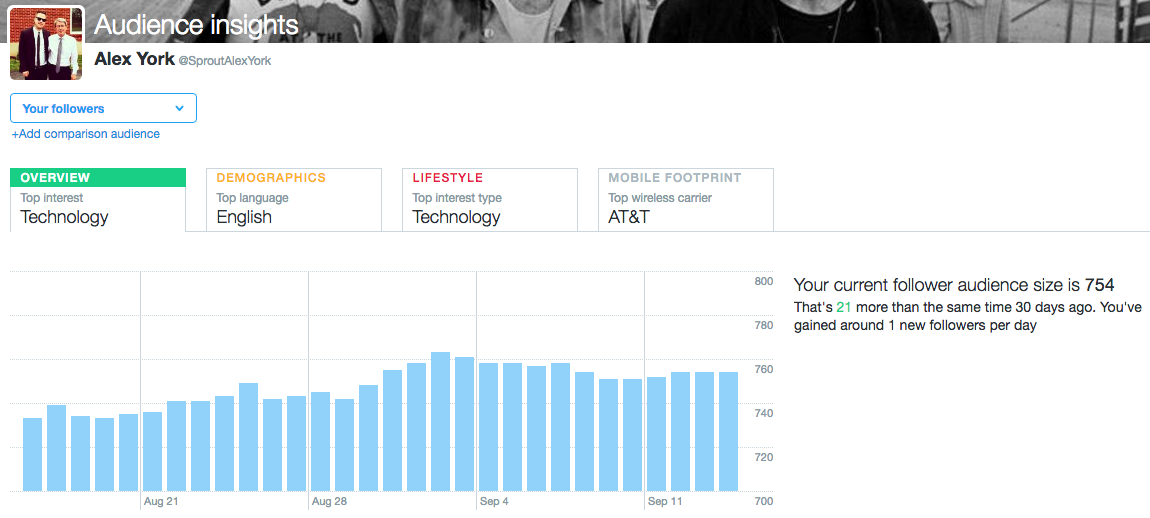
Your Twitter data changes depending on your audience type. Twitter Analytics allows you to view audience insights for all Twitter users, your followers and your organic audience. Additionally, you can add a comparison audience for competitor analysis.
After you’ve selected your audience, you can see things like:
- Top Interest: The subject most likely to be in common with your audience.
- Top Language: The top language among your audience.
- Top Interest Type: The most common lifestyle category for your audience.
- Mobile Footprint: The top used wireless carrier for your audience.
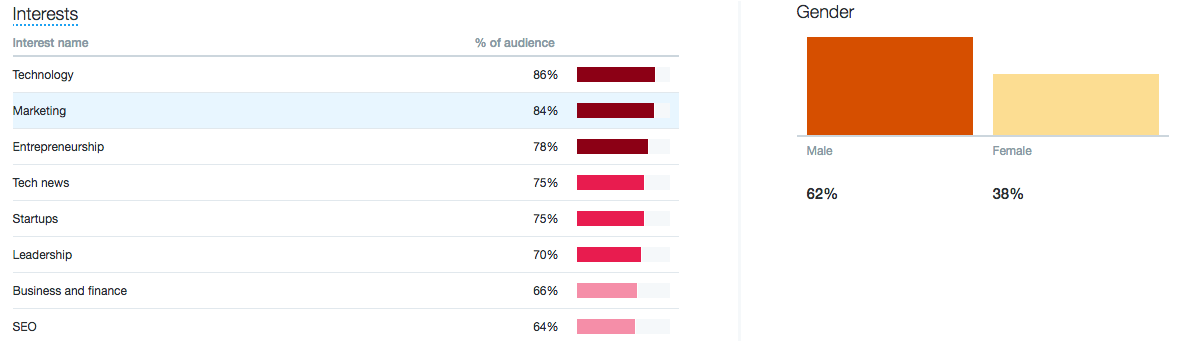
The audience insights section also details the gender of your Twitter followers and the percentage of your audience to each interest. This percentage gives you a much more in-depth look at what interests your audience might have on Twitter. Use this information to your advantage and know what type of content resonates the best with your audience.
4. Browse Events on Twitter
Being relevant in your industry shows your audience you’re one step ahead of the crowd. This means you should know when important industry-related events are happening. On the events section, you can see an overview of the biggest events trending on Twitter. You can go further by viewing events in:
- Sports
- Movies
- Recurring Trends
Remember to take caution when you Tweet about industry-events unrelated to your audience or brand. While DiGiorno Tweets randomly and sees payoffs, your brand might not have the same success.
Use the information here to get a better idea of what’s happening in the world of Twitter and easily create campaigns around specific events.
5. More
Like we mentioned above, Twitter is constantly trying to improve its data collection tools. In the More section, you have access to information on:
- Twitter Cards: This section allows you to see URL clicks, install attempts and Retweets from your Twitter Cards. You can also select specific date ranges to see changes over time, card types, links, influencers, Tweets and sources revolving around your Twitter Cards.
- Videos (beta): Whether it’s promoted or standard video, you can see views, completion rates, total minutes viewed and retention percentages for your videos. This is absolutely critical to measuring your social media video process.
- App manager: Twitter allows you to add different apps to the platform to help you get more targeted users and to optimize content.
- Conversion tracking: Here you can connect your website tag to Twitter to track audiences based on website behavior. Additionally, you can use this section to measure relevant and important events on your site so you know how your campaigns, updates or site changes affect Twitter traffic.
Using Sprout Social’s Twitter Analytics Tools
Even though Twitter stepped up its analytics game, Sprout Social lets marketers go above and beyond. Through our powerful Twitter analytics tools, social businesses gain deep insights into keyword, demographic and hashtags analytics.
One of our most robust tools included in our suite is the Twitter Profiles Report. This presentation-ready Twitter report goes the extra mile with tackling Twitter data from one or multiple profiles so you can extract actionable insights for multiple teams across your business.
Do you know how well your content is performing? Are users engaging with your Tweets? Have new users responded to your content? These are all important questions you should ask yourself about your Twitter data.
Twitter Performance Summary
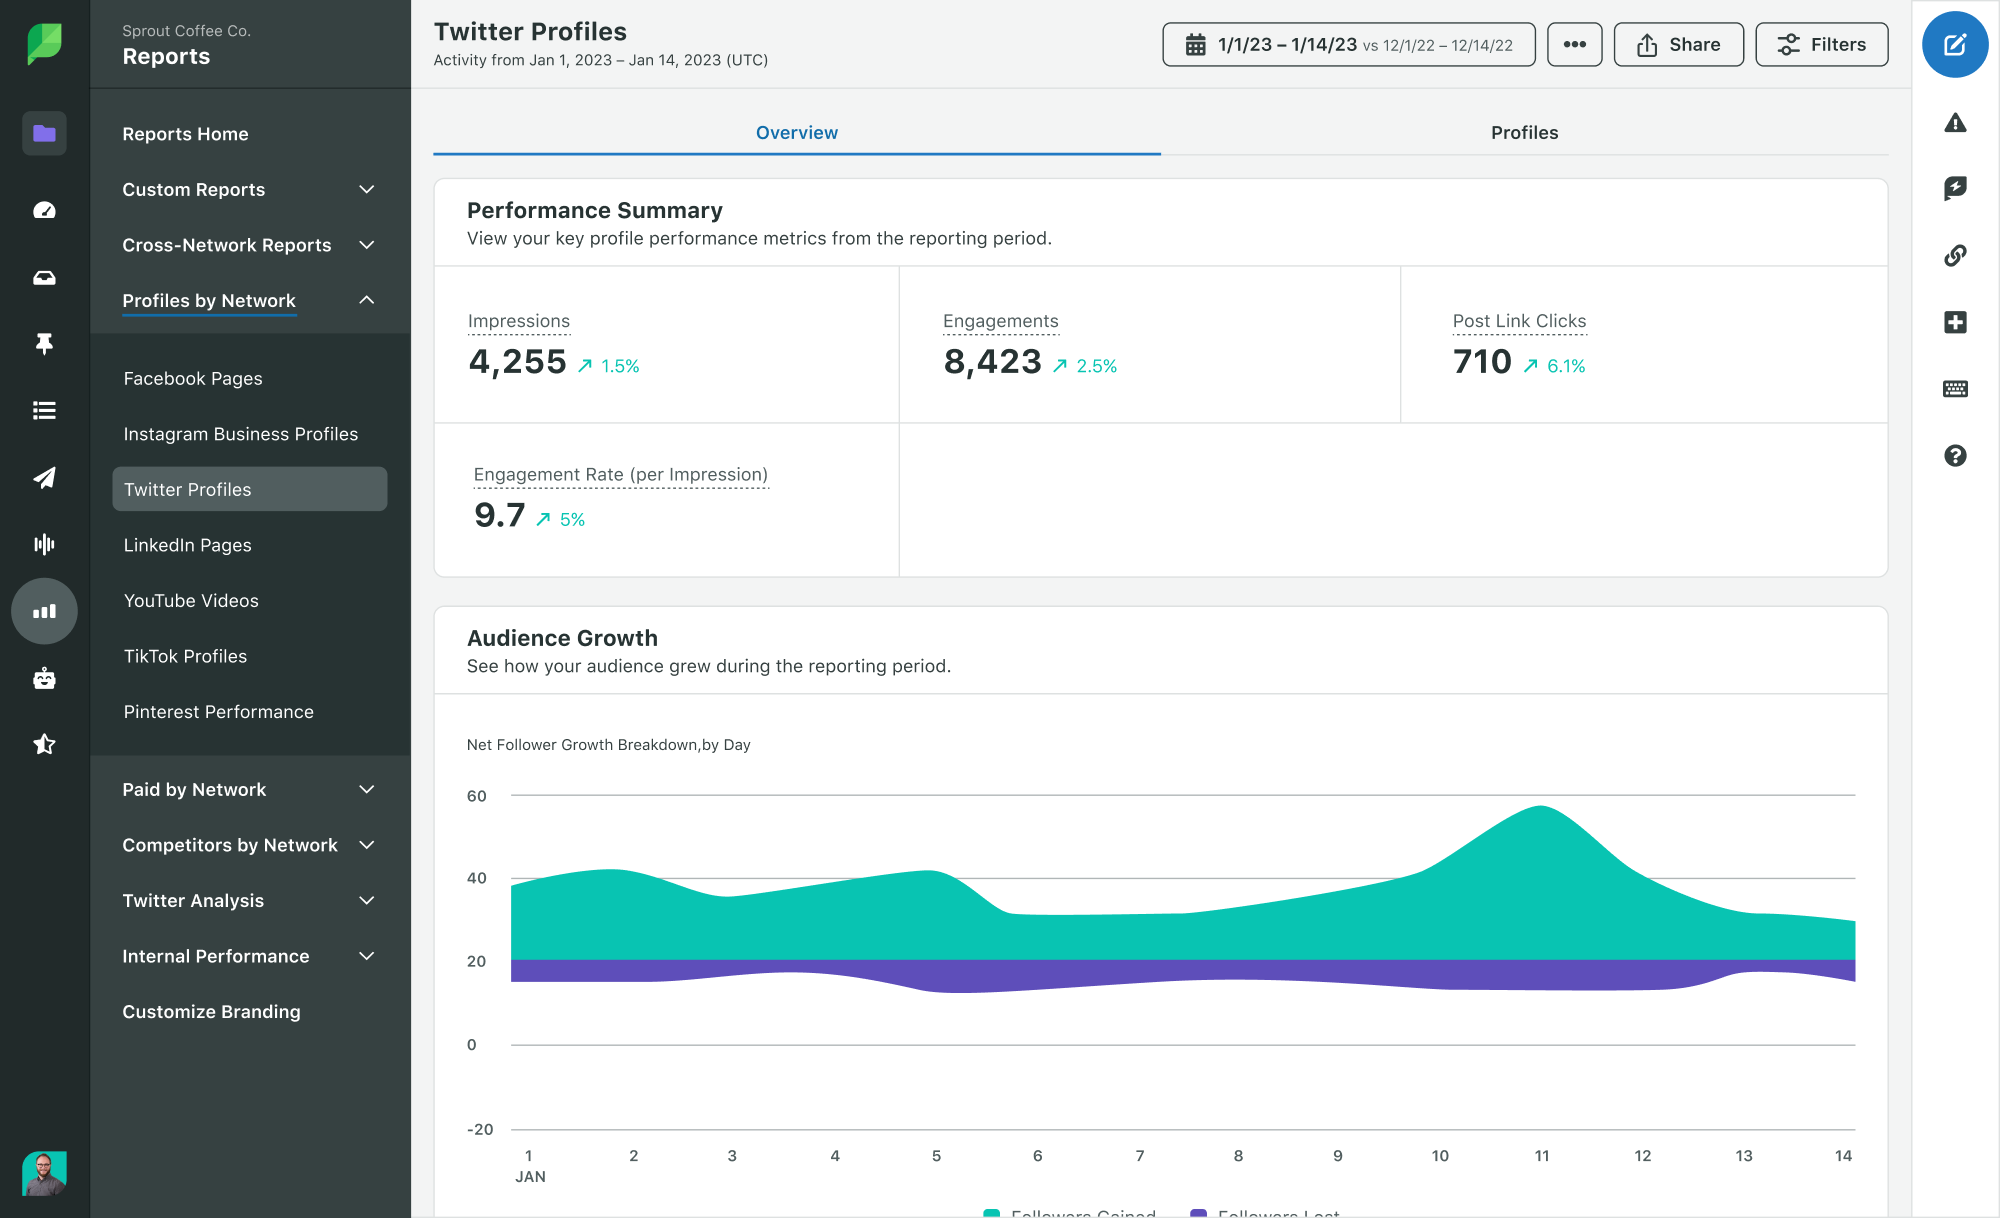
Sprout Social’s Twitter Performance Summary provides key statistics at a glance in your selected report time frame. For the Twitter profiles you select you can view:
- Organic Impressions
- Engagements
- Post Link Clicks
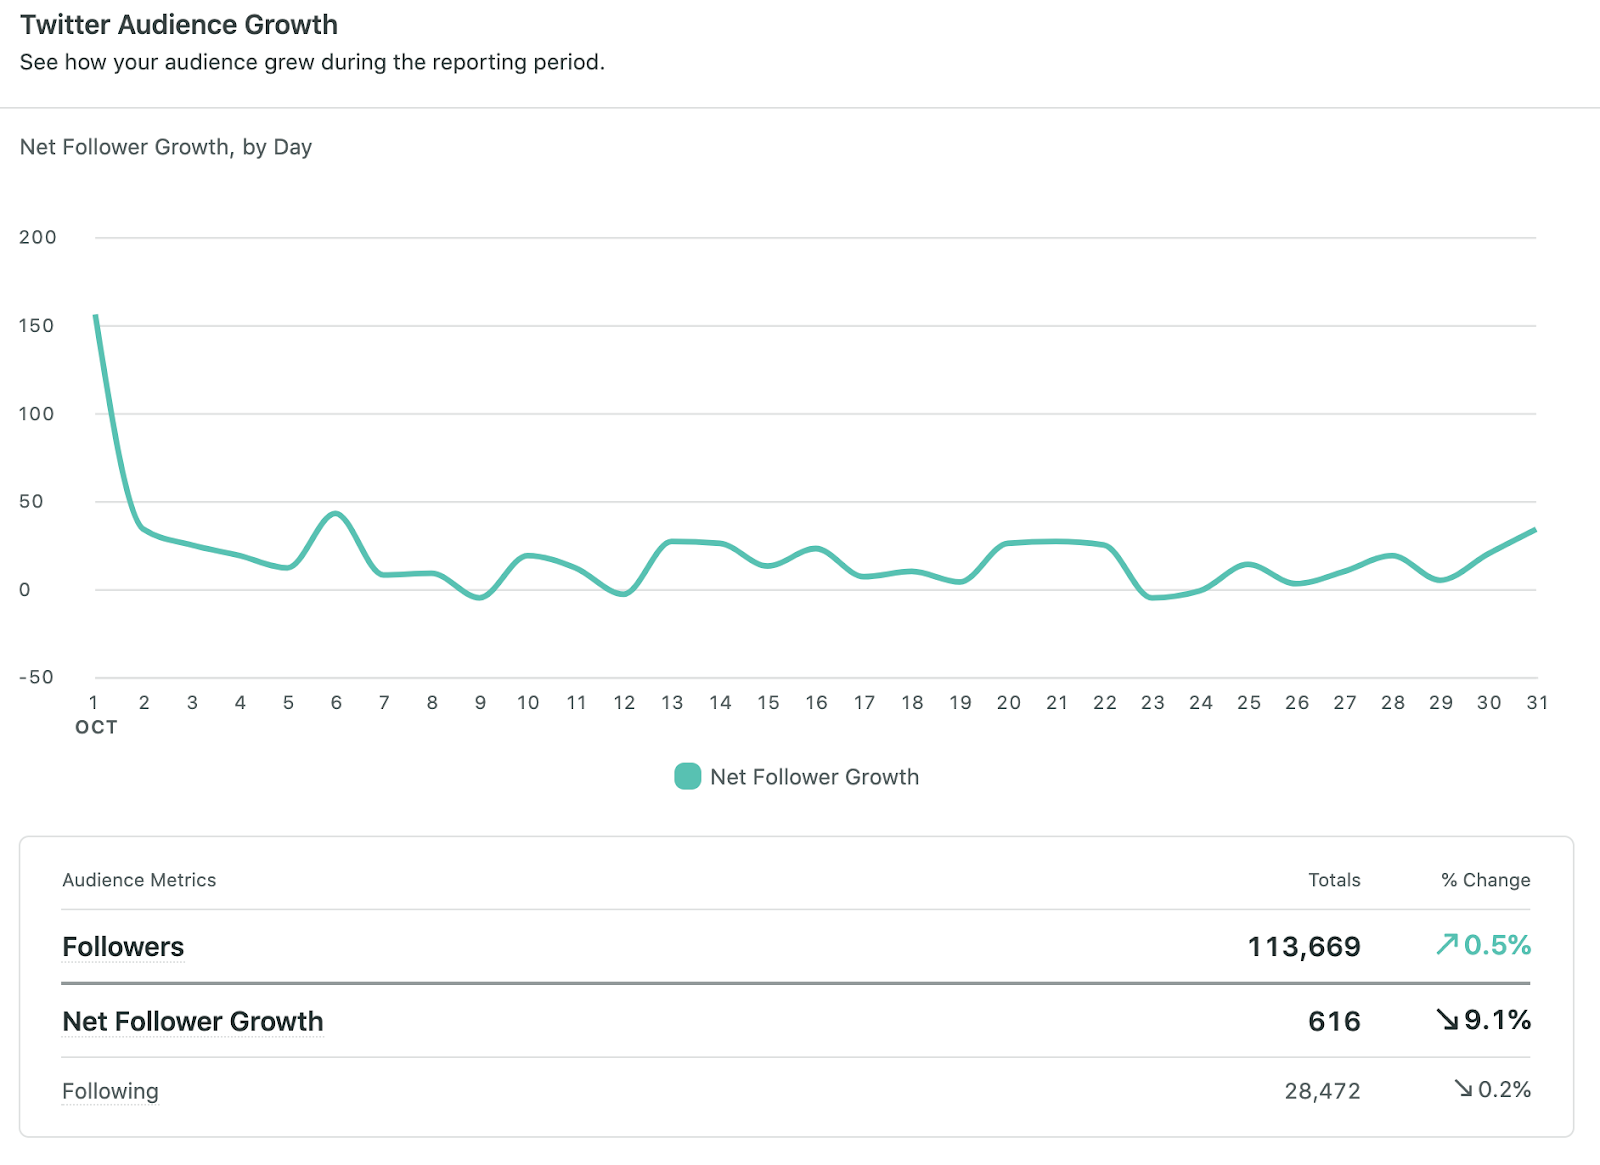
Audience Growth
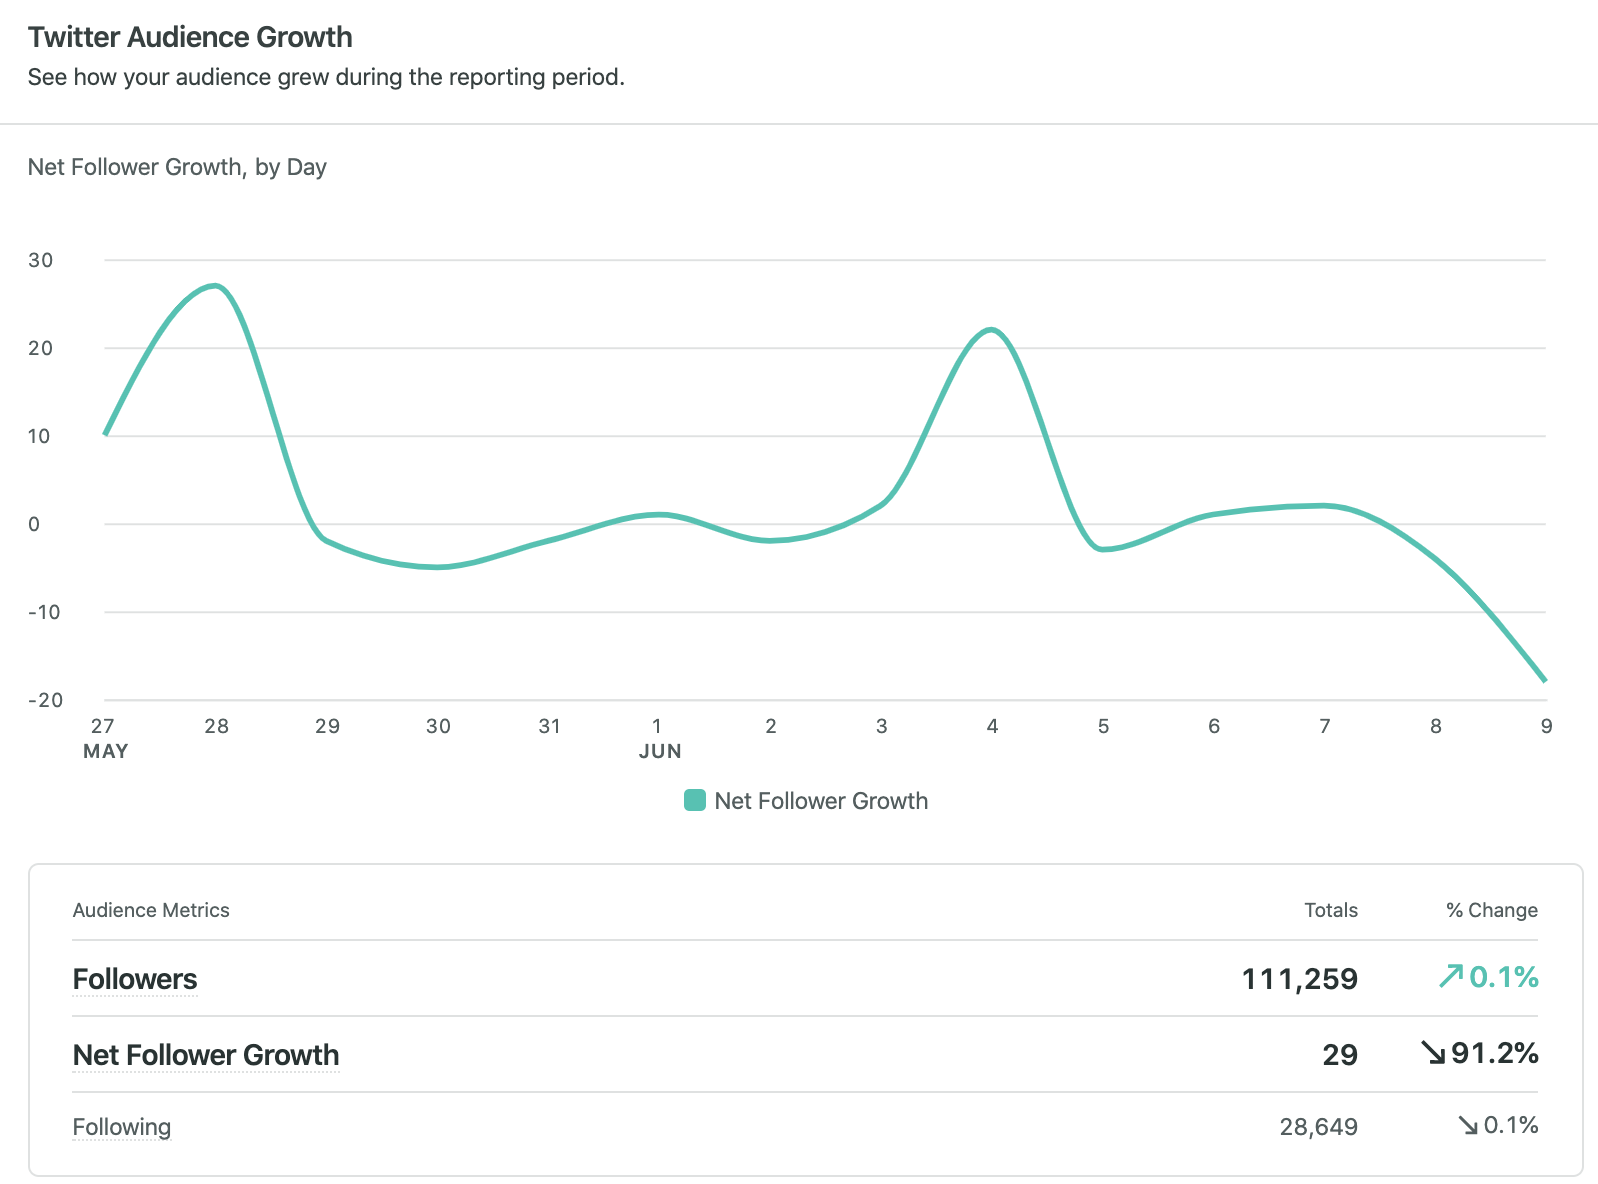
This section breaks down your follower growth during a selected time frame. Measuring your audience can help you plan new content strategies to reach out to more people. Look for similarities in content published and audience peaks in this report to better plan your posts.
You can get details of important Twitter metrics such as:
- Followers: Total amount of Twitter followers you had on the last day of the reporting period.
- Net Follower Growth: The net number of Twitter followers you acquired during the reporting period.
- Following: Total number of users you’re following on Twitter on the last day of the reporting period.
Twitter Publishing Behavior
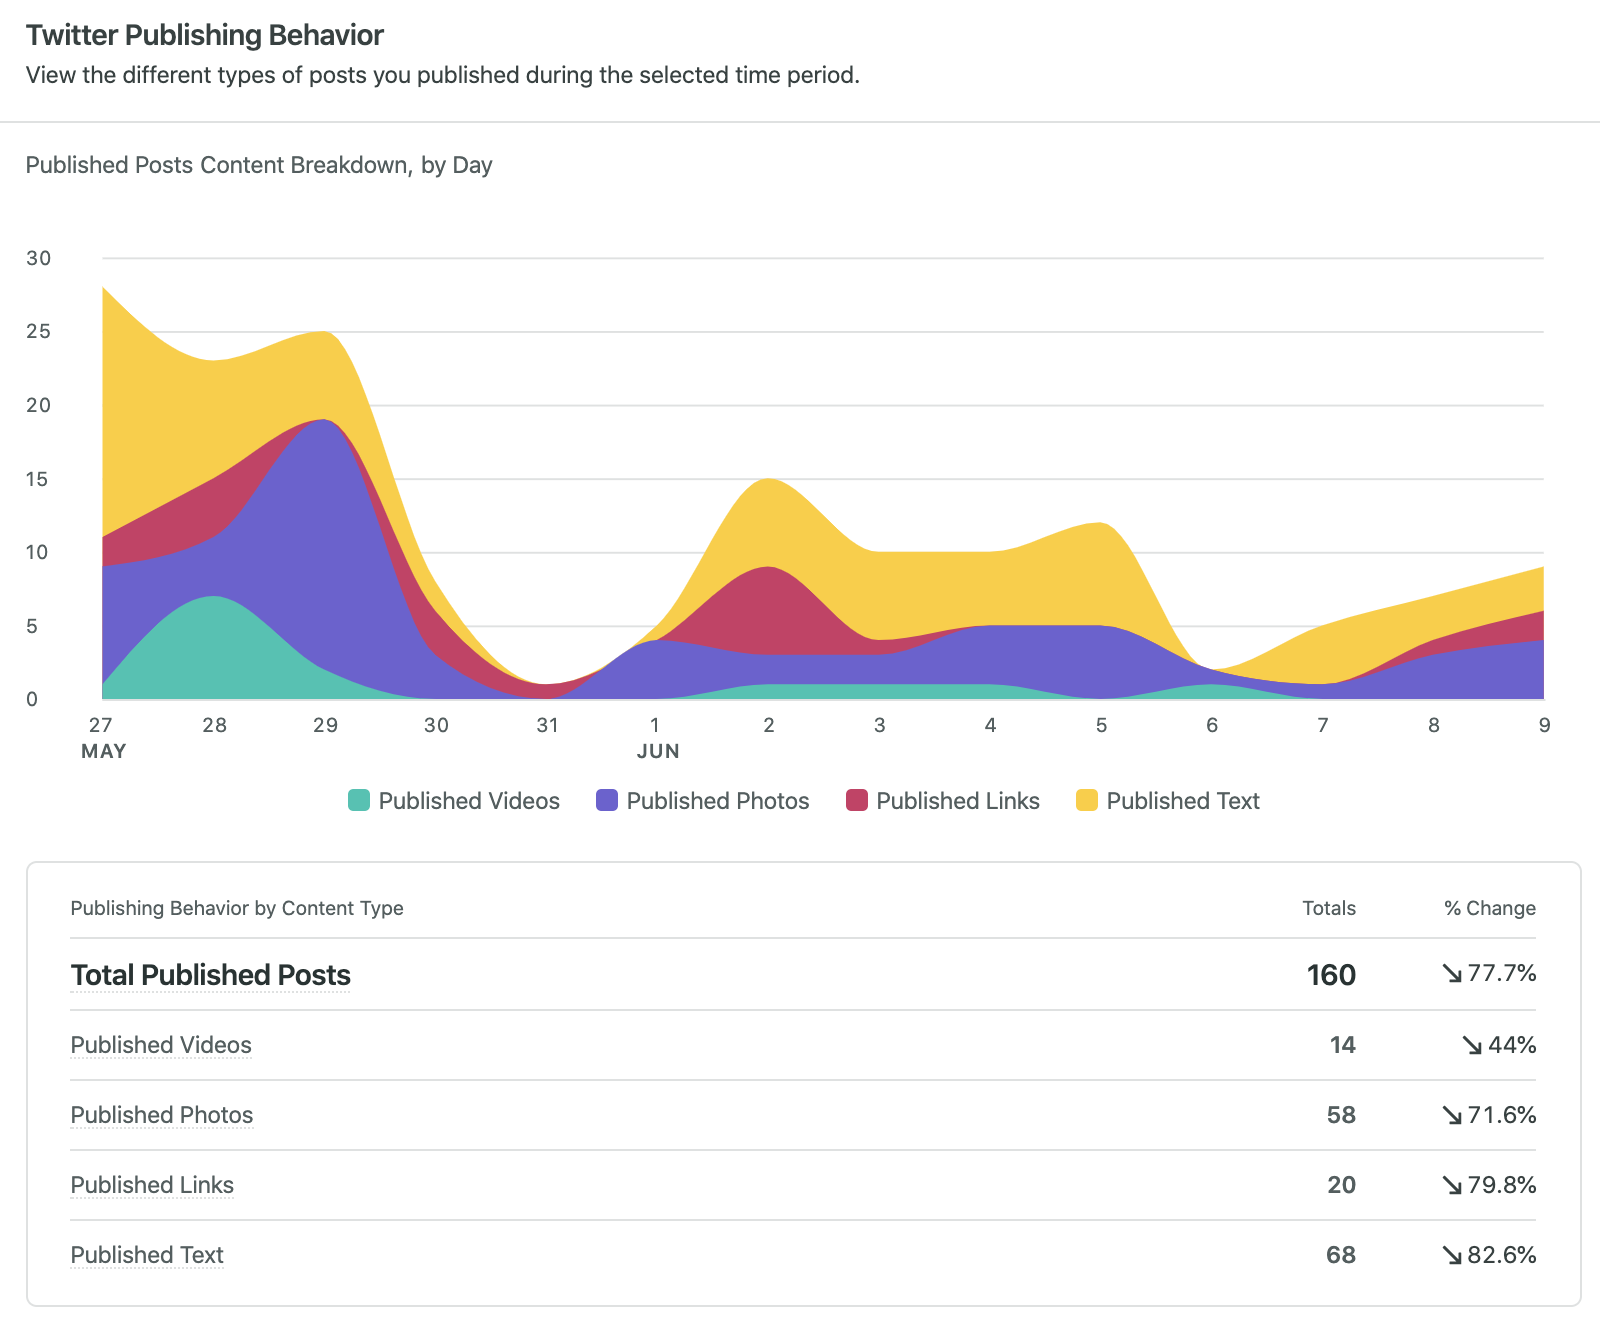
In the Publishing Behavior section, you can see the different types of posts you published during the time period you selected. Dive in and see the total number of video, photo, link and text posts for your reporting period.
Your Top Posts
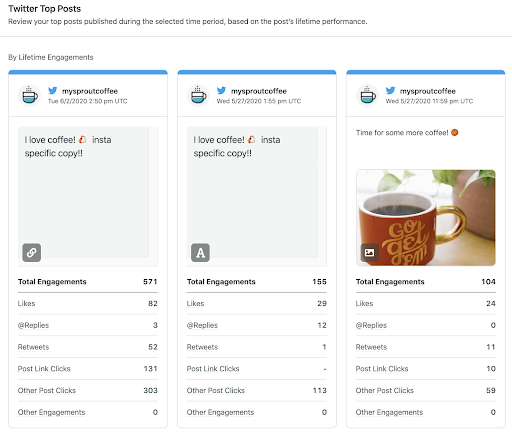
Approximately every second, 6,000 Tweets are sent out on Twitter. This equals roughly 500 million Tweets per day. But how do you know which of your posts are performing best? In the Twitter Top Posts section, you can quickly review the top posts published during your reporting period.
You’ll get better insight on how many likes, replies and retweets each post received. This can help you make decisions in the future on how to structure your posts and what types of content your audiences interact with the most.
Twitter Impressions
If you want to get more granular, the Twitter Impressions section of the report provides you with a high-level overview of the amount of impressions your posts received per day for the reporting period.
You can see how many times your content was viewed by the Twitter community and compare these impressions to your engagement to better optimize your social strategy.
Twitter Engagement
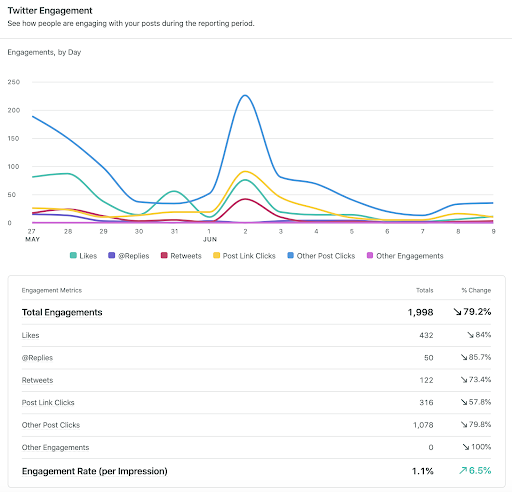
Sprout helps you visualize Twitter trends with unique audience engagement metrics. Unlike Twitter’s audience reporting, you can dig deeper with Sprout’s custom reporting on things like:
- Likes
- Replies
- Retweets
- Post Link Clicks
- Other Post Clicks
- Other Engagements
- Engagement Rate per Impression
With custom date ranges, you can get more information on your audience engagement Twitter data. This will help your brand know what specific time periods drove the most engagement and reach with your audience.
Audience Demographics
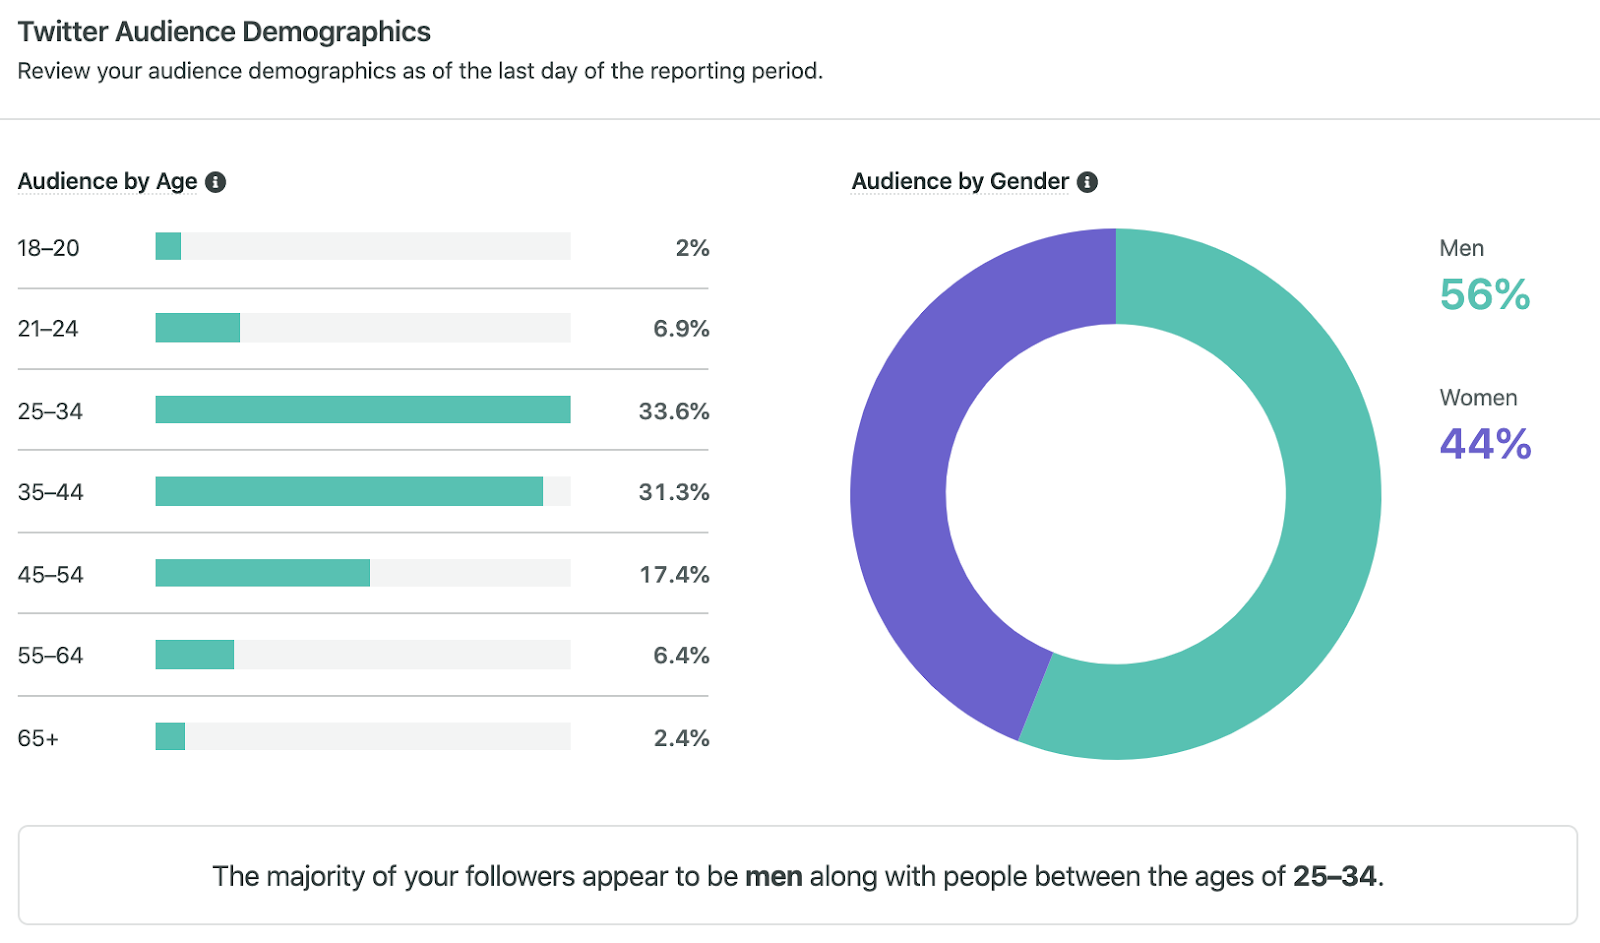
Instead of switching between different Twitter profiles and analytics tabs, Sprout provides your audience demographics all within the same report. Make sure you know what audience you’re effectively reaching to better promote and market your content.
Twitter Stats by Profile
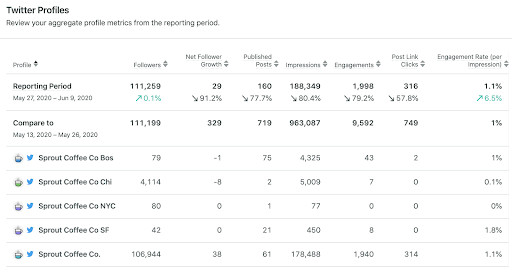
If you have multiple Twitter accounts for your brand, it’s nice to see how each profile stacks up against one another with basic Twitter metrics. With the Twitter Profiles section of the report, you get a top-level view of your Twitter data per profile such as: followers, net follower growth, engagements and total impressions.
What Twitter Data Teaches Your Business
Now that you have a better idea of the type of Twitter data you can pull from the native platform and through third-party tools like Sprout Social, it’s time to put the numbers to use. With Sprout Social, these statistics are just the beginning of Twitter data you can pull for your profile.
Other reports such as Twitter Keyword, Twitter Competitors and the Trends Report all detail your Twitter efforts even further.

Social media data can showcase several things for your business. Whether you want to see what content performs best or who your core buyers are, data can decipher your overall Twitter production. Marketing executives don’t want to waste money on something that is hard to prove profitable.
Collecting, measuring and analyzing the right Twitter data can back up your social media marketing efforts with in-depth analytics. Sprout Social provides presentation-ready reports at your fingertips to show your team or higher-ups just how well your Twitter marketing is paying off.
Want to see what Sprout Social can do for your business on Twitter? Try our powerful Twitter analytics tools for free with a 30-day trial!
Use of Twitter nomenclature across Sprout refers to newly rebranded X platform and related terminology.
- Categories
Best times to post on Twitter (X) in 2024
Published on April 15, 2024 Reading time 10 minutes - Categories
10 Twitter automation tools for your brand in 2024
Published on November 22, 2023 Reading time 7 minutes - Categories
How to create a Twitter marketing strategy for your brand
Published on September 8, 2023 Reading time 11 minutes - Categories
How to use Twitter advanced search to get more leads for your brand
Published on July 24, 2023 Reading time 8 minutes
Share