
What are Twitter impressions & why are they so important to Twitter?

Written by Jenn Chen
Published on June 11, 2018
Reading time 7 minutes

Of the numerous X (rebranded as “X”) metrics to track, X impressions should be high on your list. When combined with other metrics, tracking impressions gives you an idea of how far your Tweets have gone.
X impressions are one of the indicators of brand presence. If you want to have your pizza company known across X, then you’ll care about how many times your Tweets have shown up in someone’s timeline in a month. More likely, you want your pizza company known across a certain segment of X. This means you’ll pair your impressions metric with another metric like clicks to see if the Tweets are relevant.
Impressions shouldn’t be the only X metric you track, but for this article, we’ll break down what they are and how they’re important to your brand. We’ll also examine how they interact with other metrics like reach and engagement.
Tap into the Conversation with Advanced Listening By Sprout Social
While it’s easier than ever to know the moment someone mentions your X handle or Retweets a post, you’re not necessarily seeing everything.
What about conversations about your industry in general, competitors and topics you didn’t even know you should be tracking? Enter Advanced Listening by Sprout.
Simply set your topic and let us do the rest. Learn more about how Listening can help you by requesting a demo or try it out yourself with a 30-day free trial.
X Impressions vs. Reach
X impressions are a metric readily available to any X account with a setting adjustment. If you enable X’s native tools and analytics for your account, you’ll see activity per Tweet in X.
A small graph icon appears at the bottom of each Tweet and upon opening it up, you’ll be given some data about the Tweet, including impressions and Total Engagement. This feature is available on both the web and mobile versions of X.

Impressions on X is a total tally of all the times the Tweet has been seen. This includes not only the times it appears in a one of your followers’ timeline but also the times it has appeared in search or as a result of someone liking the Tweet. It does not include times someone may have seen the Tweet through an embed on a website, third-party platform like Sprout Social or via text preview. It only counts when you see it on X itself.

In the X Analytics Dashboard, you’re see how your Tweets performed over time. Hovering over each day gives you data on organic impressions, promoted impressions and Tweets. It’s easy to filter by a date range and to see how your top Tweets performed.
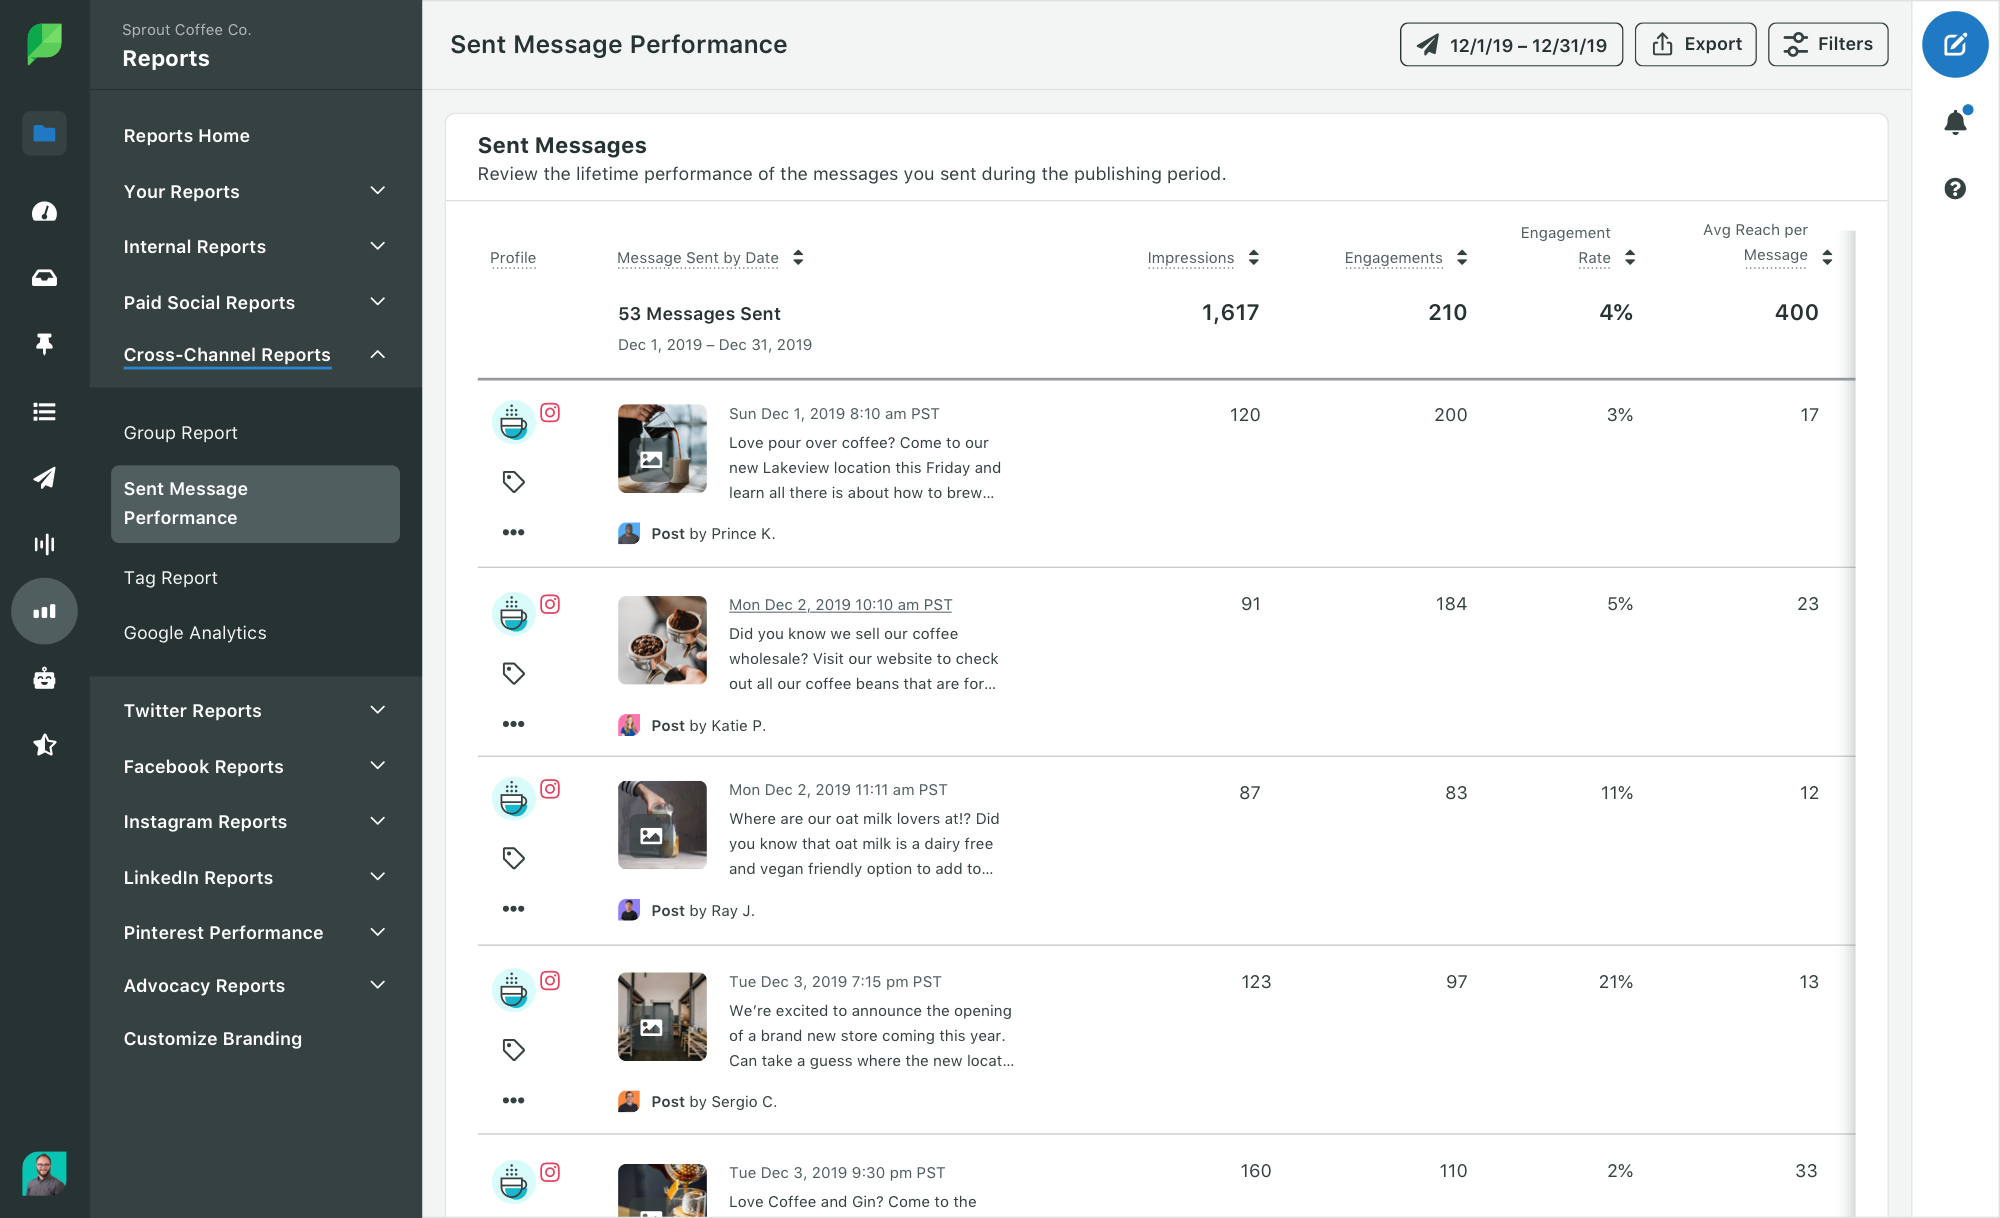
In Sprout Social, we added another metric called Potential Reach. You can find this through your X report under the X Top Posts section or in your Sent Messages Report.
Potential Reach is defined as the total number of people who may have seen your Tweet. This means all of your followers plus any of the accounts’ followers who retweeted you. So if you have 50 followers and an account who Retweets you has 200 followers, your Potential reach is 250. With every account that Retweets you, the followers get added on. It does not compensate for duplicate accounts, so if one person follows two accounts that Retweeted the Tweet, they still get counted as two in Potential Reach.
When paired together, impressions and potential reach can give a clearer view on your Tweet. Since it’s near impossible for your Tweet to have reached every one of your followers, your Tweet’s actual reach is likely between your impressions and Potential Reach metric.
How X Impressions & Engagement Rate Interact
The ideal Tweet will have both a high impression number and a high engagement rate. Having both means that your Tweet spread far and was relevant enough for people to engage with. The engagement rate is found in X Analytics per Tweet and over time. This way, you can compare how one Tweet performs to the average over the month.
The Engagement Rate is calculated by dividing the number of engagements by the number of impressions. Engagement includes any way someone interacts with a Tweet, including but not limited to, Retweets, clicks and Likes.

In Sprout Social, our X report breaks down impressions and engagement further. You’ll see engagements and organic impressions per follower and per Tweet. All of these metrics are important because they give you insight on your audience and its activities.
If you have a low impression number with a high follower count, your followers may be inactive. And if you have a high impression number with a low engagement rate, then your Tweets could use some work. If you have the opposite, then you should try Tweeting at a different time.

To get an idea of when to Tweet, we’ve done research on when the ideal time to post on X is based on highest engagement. The most common industries and their statistics are highlighted in the piece, too. Something else to keep in mind when looking at both impressions and engagement is how X’s timeline has changed.
With the introduction of the X algorithm on the timeline, engagement is one of the factors considered when highlighting a Tweet. The more you’ve interacted with a brand, the more likely one of its Tweets will show up in your feed. So even if you didn’t Tweet at the best time, you may still show up in someone’s feed as part of “In case you missed it.”
X impressions and engagement go hand in hand. Not all Tweets will be perfectly high for both metrics but knowing how to adjust your Tweet content and posting behavior will go a long way to improving them.
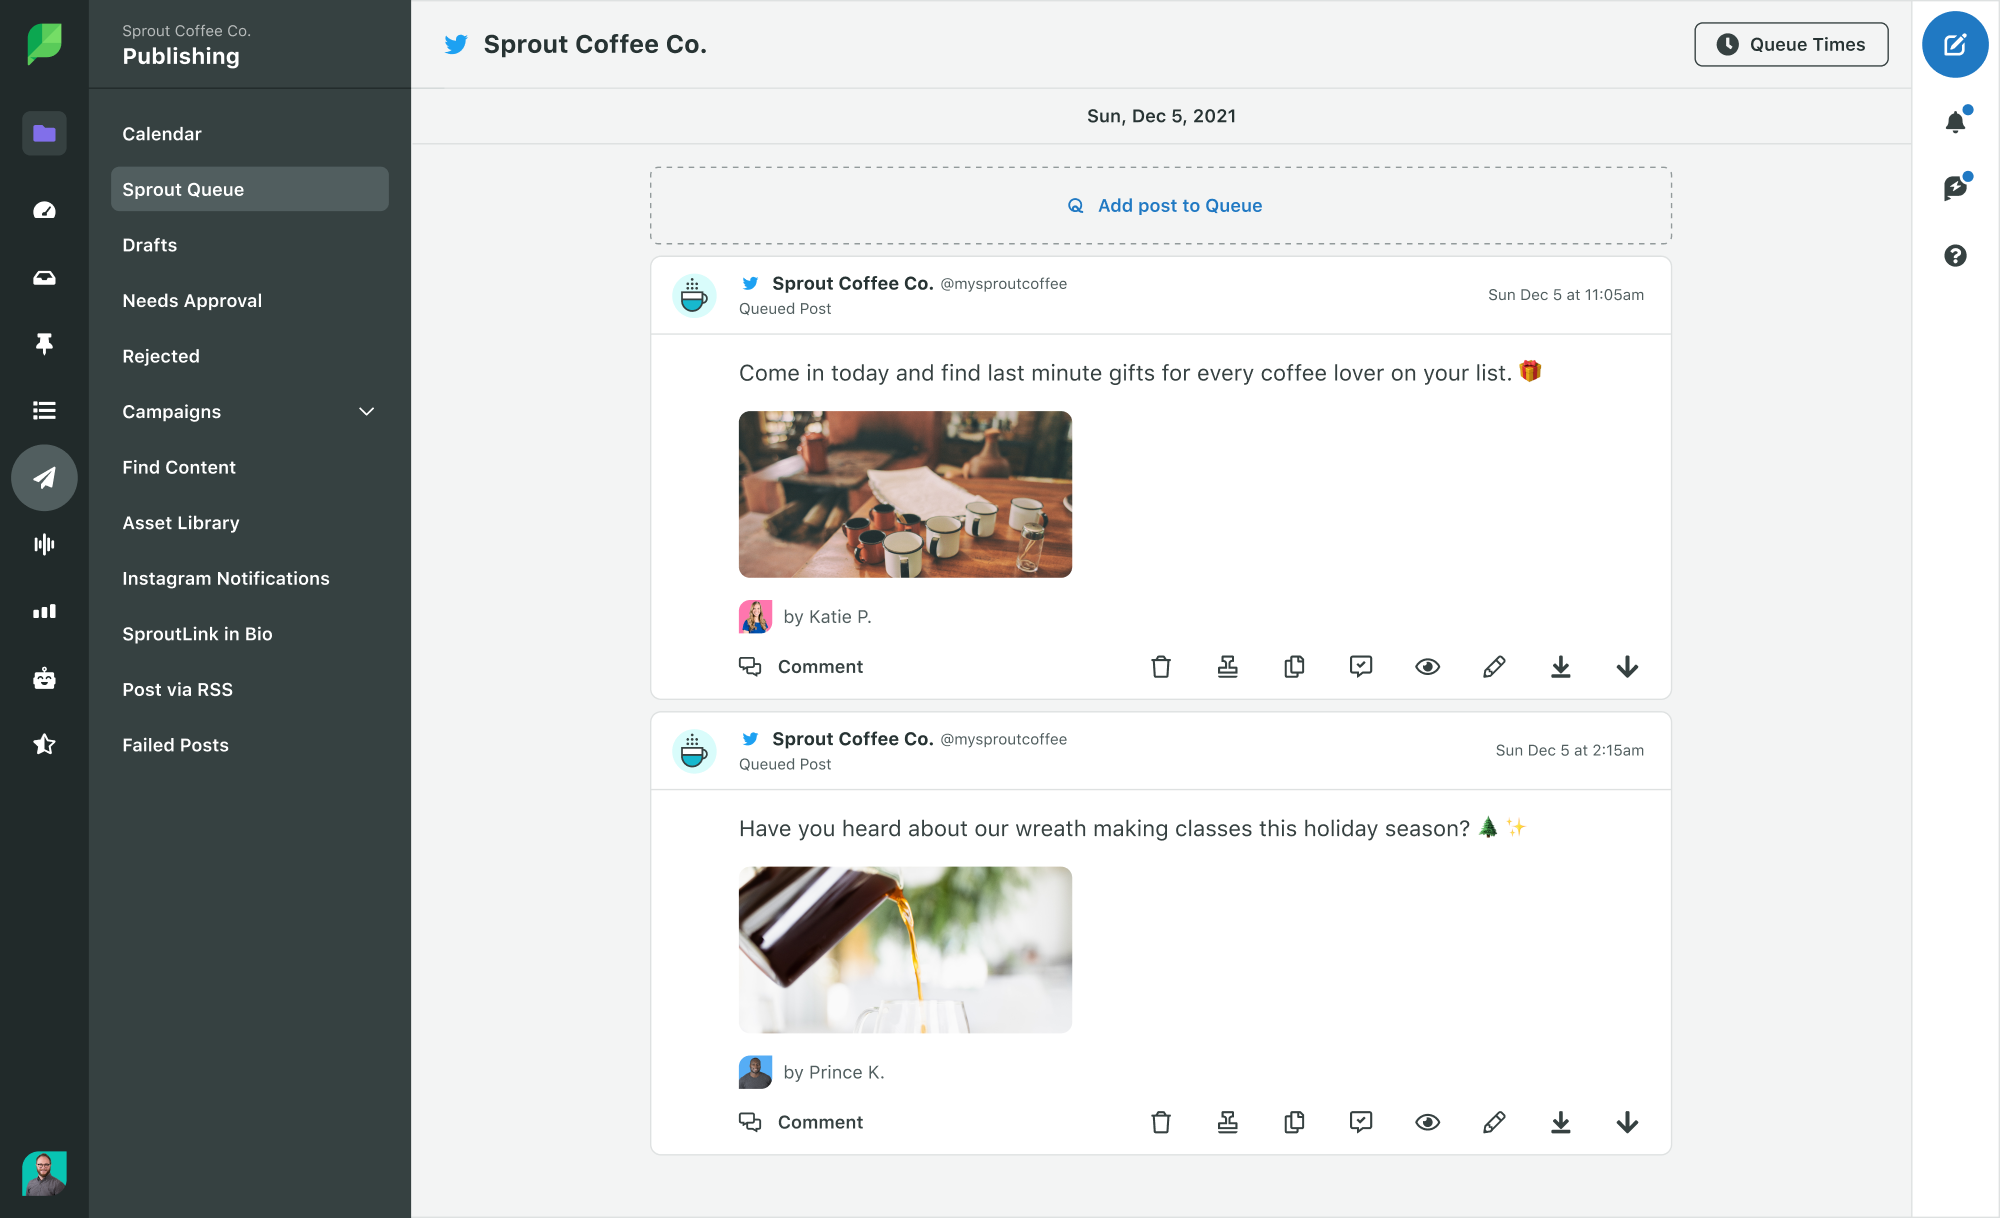
If you’d prefer not to think about when to post for the most engagement (and likely, the most impressions), try utilizing a feature like our ViralPost. Given some posting time guidelines, Sprout’s patented algorithm will find the best times to post for your account and automatically Tweet for you.
ViralPost takes a look at your audience’s engagement history and adjusts the posting times for you. This way, you can Queue up posts without having to worry about when to post them.

3 Ways to Increase Impressions
Aside from some of the tips that we’ve already mentioned above, we’ve listed three more ways to increase impressions for your Tweets. If you apply these tips on a consistent basis, you’ll notice your impressions increasing.
1. Engage with Brands, Influencers & Followers
This seems like a no-brainer. The easiest way to increase your impressions is to consistently engage. Interact with other industry brands, find influencers and talk to them in conversation and answer your followers’ questions.

Find the top followers for your account and interact with them. You can find this information in your native X Analytics or through a reporting software like Sprout. Once you’ve identified the top accounts, make it a priority to engage with them.
For engaging with your followers or potential followers, don’t just stop at responding to questions. Converse with them on Tweets they post. The more you engage, the more impressions you’ll have.
2. Consistently Post a Variety of Content
By now, you’ve probably already heard about the 80/20 rule. This states that essentially 80% of your content should be non-branded. That 80% is a large chunk of content, which you can fill up with educational info, industry news and conversation starters.
Which Signature Wrap would make the long weekend complete?
A. Chipotle Southwest Steak & Cheese Wrap
B. Turkey, Bacon & Guacamole Wrap
C. Savory Rotisserie-Style Chicken Caesar Wrap— Subway® (@SUBWAY) May 25, 2018
Subway used X’s poll feature to ask their audience which wrap they’d be most interested in. With a total of 1747 votes and a number of engagements, the Tweet started a conversation and acted as an impromptu user survey.
So while you’re finding some great content to post, you also need to be posting it on a consistent basis. Without Tweeting often, followers forget you’re there and engagement drops. And when engagement drops in the algorithm, your Tweets are less likely to be shown.
To get an idea on what to Tweet about, look at your Audience’s top interests in the X Analytics dashboard. Focus on these topics at the beginning and then adjust as you learn more about what your audience wants.

Another way to find topic inspiration is to look at how your past Tweets have performed. See if there are any correlations between the top performers, like topic, style, Tweet length or media. Try and duplicate the correlations to see what’s resonating.
3. Improve Your Media
When scrolling through your timeline, Tweets with large media items are likely to catch your eye first. Take a look at your top Tweets and see if most include some sort of photo or video. If it’s a link, it’s likely that a preview image was generated.
If you are posting branded content, consider improving your media. Whether it means creating some branding guidelines or hiring a videographer, quality media grabs attention. Our recommended guidelines for a X image is at minimum, 440 x 220 pixels (2:1 ratio), and horizontally centered to avoid odd cropping.
Get ready for a turtley awesome #WorldTurtleDay SHELL-ebration on May 23! Join us for fun activities, watch turtles participate in enrichment painting, meet a turtle at the Reptile Keeper Lab and more. Plus, join us at 2:30p to wish Sonny (51) and Bubba (71) a Happy Birthday!🎉🐢 pic.twitter.com/v7kHU1sePT
— Columbus Zoo (@ColumbusZoo) May 17, 2018
The Columbus Zoo regularly uses photos, graphics and videos in their Tweets. Without the addition of rich media, the Tweets would seem lackluster and less engaging.
Another easy way to improve on your media is ensuring that your blog posts have great images optimized for X. You want that large preview image in the link to be on brand and enticing enough for someone to click on it.
In Conclusion
After reading through the piece, we hope you learned a more in-depth review of why impressions are important and how you can improve on them for your brand. No metric should be the sole measure of brand success on X.
Impressions are no different. It’s only when you look at impressions with other metrics like reach or engagement that you can understand more on where you can improve.
Use of X nomenclature across Sprout refers to newly rebranded X platform and related terminology.
- Categories
Best times to post on Twitter (X) in 2024
Published on April 15, 2024 Reading time 10 minutes - Categories
10 Twitter automation tools for your brand in 2024
Published on November 22, 2023 Reading time 7 minutes - Categories
How to create a Twitter marketing strategy for your brand
Published on September 8, 2023 Reading time 11 minutes - Categories
How to use Twitter advanced search to get more leads for your brand
Published on July 24, 2023 Reading time 8 minutes
Share