16 Sep Paying Homage to the Social Technographics Ladder

If you’re an OG in the social media marketing business, there’s little chance that you don’t remember the Social Technographics Ladder created by Jeremiah Owyang, Josh Bernoff, and Charlene Li when they worked at Forrester Research.
The year was 2007 and Ignite Social Media was opening as the first social media agency in the United States. Blogging had been kicking around for about a decade at this point, and the Cluetrain Manifesto had existed for nearly 8 years. Lisa Braziel and I were still writing “Social Media is a Cocktail Party” and brands were just starting to wonder if, and how, they should engage with consumers on social media.
Enter the Social Technographics Ladder
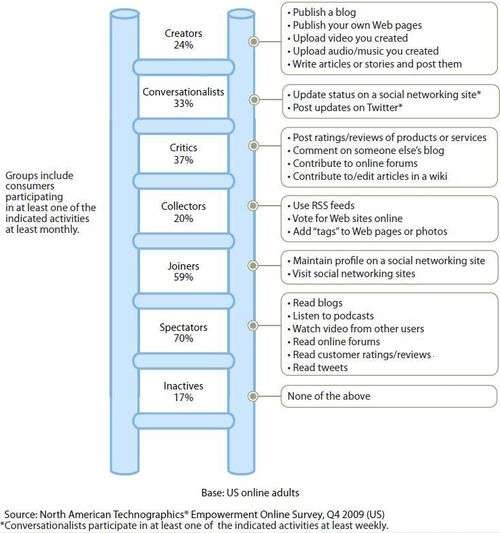
As I understand it, the trio at Forrester built the Social Technographics framework for their excellent book, Groundswell, and it was a helpful way for those of us in the space to explain how people were engaging with sites like Friendster, MySpace, Blogger, and Facebook.
In my experience, it helped brands understand the whys and hows of people using social media tools and networks. And the fact that those labeled “Inactives” were only 17% of the audience really woke some people up. I clearly remember discussing this chart with folks from Microsoft before we started running the Windows social channels for them.
In early 2008, the team released a tool that allowed anyone to input ages, genders and/or countries of a particular target audience and get a sense of how many people fit into each rung on the ladder.
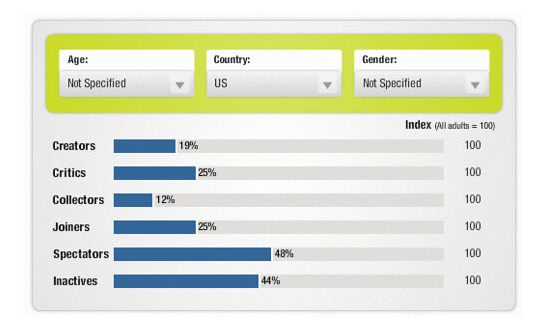
While it wasn’t fancy, we used that tool a fair amount to show brands that their customers and prospects were increasingly migrating to the social web.
Social Technographics Today
As near as I can tell, Forrester now publishes what they call the Consumer Technographics Benchmark Survey, which covers far more than social media. That seems like a logical step for them to take, but I do miss the simplicity of the original ladder. It was the right tool at the right time.
But my search for an updated ladder got me wondering, how do people use the social web today? I didn’t find a ton of data, but our friends at eMarketer had some insights as they typically do, at least for what Facebook users were doing in March of 2020 (conducted just before COVID really shut things down).
Why Do People Use Facebook?
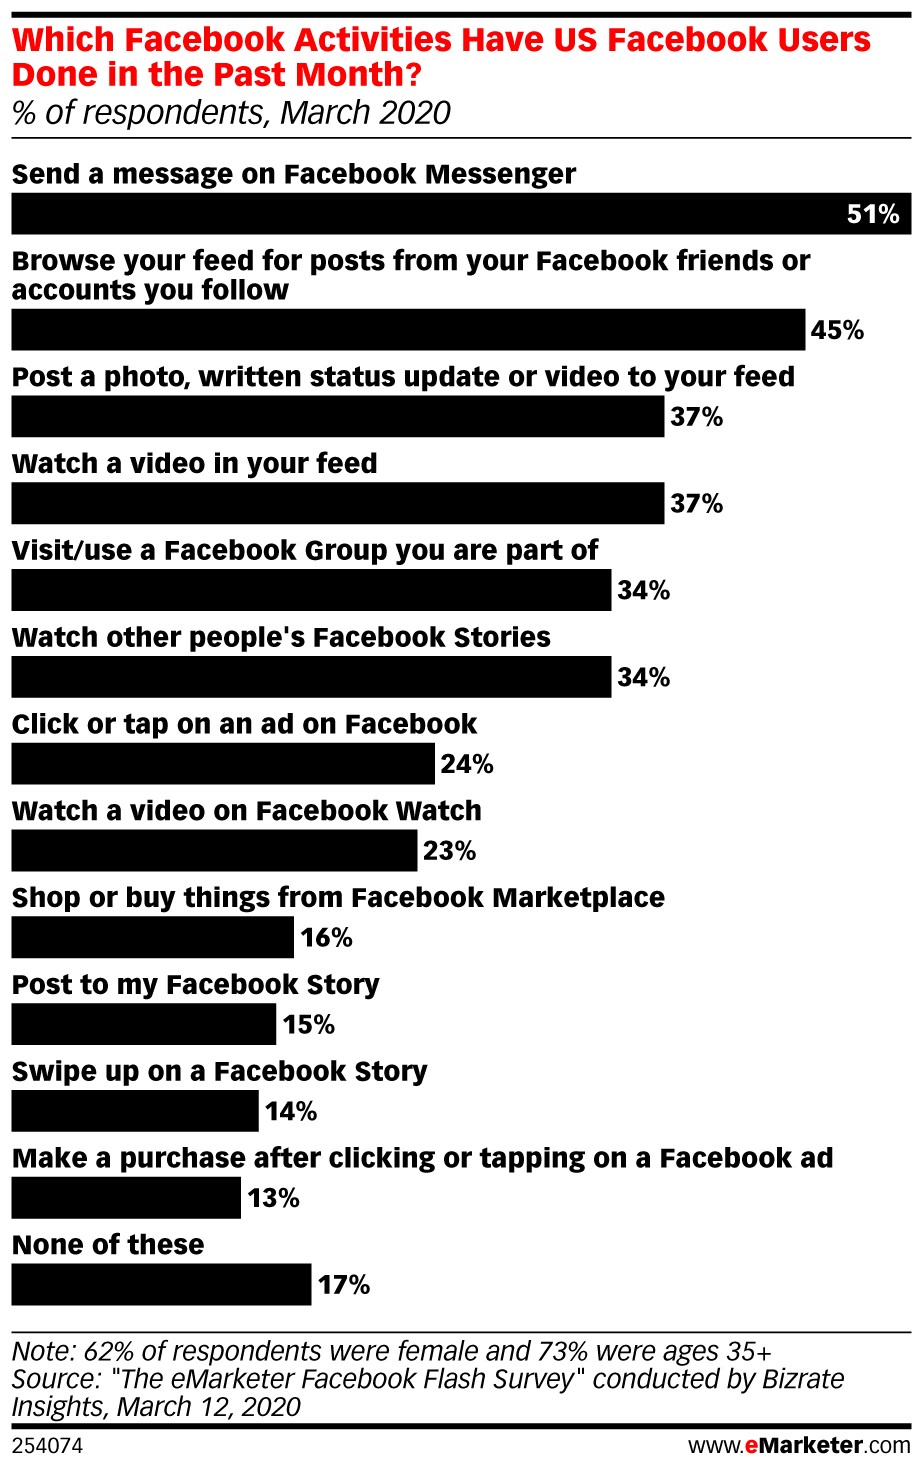
What we see is that survey respondents were most likely to use Facebook for:
- Sending a message via Messenger (51%)
- Browsing the feed (45%)
- Posting a photo, video or written status update (37%)
- Watching a video (37%)
- Visting a Facebook Group (34%)
- Watching Facebook Stories (34%)
- Clicking on an ad (24%)
- Watching Facebook Watch videos (23%)
- Shopping Facebook Marketplace (16%0
- Posting to Facebook Stories (15%)
- Swiping up on a Facebook Story (14%)
- Buying something from a Facebook ad (13%)
Why Do People Not Use Facebook?
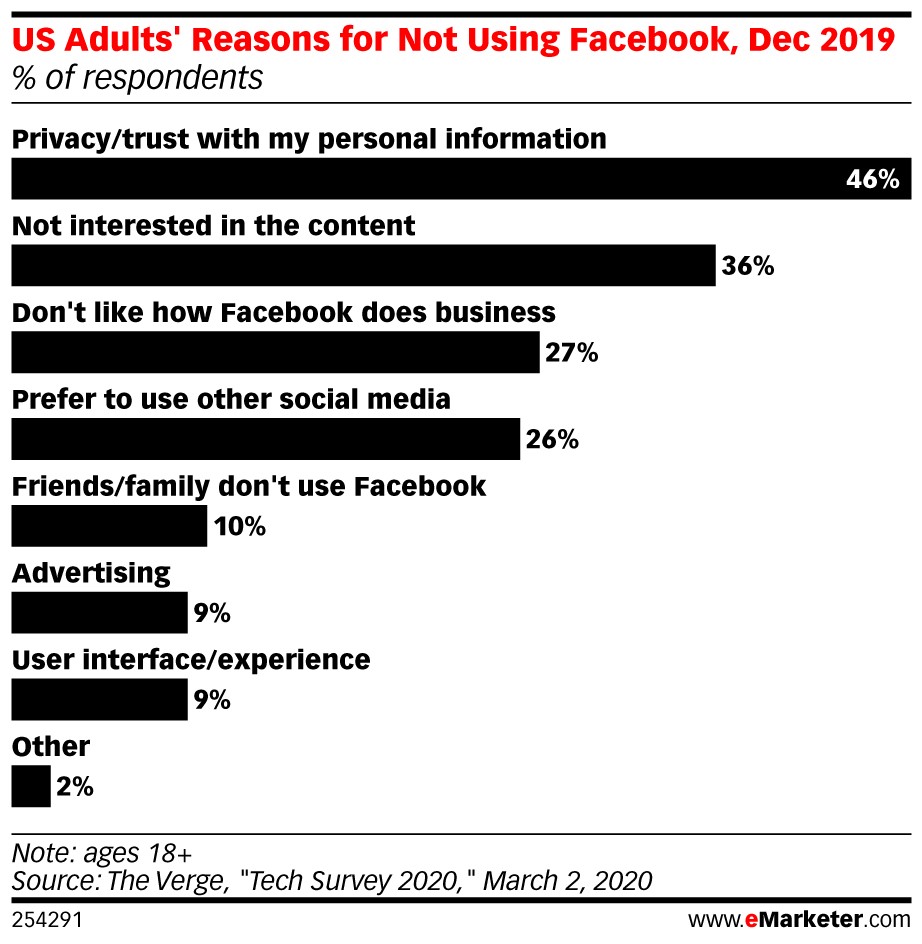
I was also able to find on eMarketer the reasons that US adults give for NOT using Facebook as of December 2019. Now do keep in mind that 61% of all Internet users in the United States do use Facebook (a number that is not expected to change over the next few years), so these non-users are about 39% of the available people.
Perhaps not unexpectedly, the main reason people don’t use Facebook is over privacy concerns, with nearly half of respondents listing that as a reason. The content just isn’t interesting was the choice of 36% of folks, while 27% of those in the survey object to how Facebook does business.
Another 26% simply prefer other social networks over Facebook while 10% say their friends and family aren’t on Facebook. Fewer than 10% blame advertising or the user experience for not using Facebook.
While I find the use cases for social media in 2020 to be very interesting and helpful as we create social media strategies for our clients, it doesn’t match the simplicity and elegance of the original Social Technographics Ladder.
The year 2007 was a crazy time in social media marketing, with new tools popping up seemingly daily and the early Social Media Club attendees trying to get their arms around the dizzying array of opportunities. In the midst of all that, the neatness of that ladder helped the industry climb to a better place.
Keep up with other news and trends in the social media marketing space, by subscribing to our e-newsletter, Social You Should Know, below.
Subscribe to Social You Should Know