.svg "quintly-logo (1)")
Data integration as a topic has become increasingly important. Companies of all sizes aim to use integrating data in their daily business to improve decision-making. Data certainly has the power to enrich decisions, but exactly which data can deliver which insights can be tough to differentiate. Before getting started with integrating data, the terminology should be clear. For this, I decided to write a glossary of terms that are often used when tackling data integration and, ultimately, the integration of social media data with other data silos. Data silo? What’s that? We’ll come to this!
API
API stands for Application Programming Interface. It's part of a software that allows and enables other programmers to connect to it. For example, as a developer of a computer operating system, you might want to provide an API to enable other software engineers to develop their own applications for your system. An API is, as the name suggests, an interface that maps out and explains the structure of a software in order to allow programmers access. Through an API, you're able to connect data points and gain more valuable insights from available data, while businesses are able to integrate their social media data in centralized data warehouses and make it available for Business Intelligence (BI) solutions using services.
BI
The purpose of Business Intelligence is to make educated business decisions based on data. Its components are collecting, integrating, analyzing, and presenting business information.
Central Data Storage
A data storage system that is used to combine data and/or the access to that data from all accessible databases and data warehouses. This makes accessing data easier to maintain.
Centralized Analytics
Centralized Analytics describes the combination of all relevant steps of analysis in one tool. When it comes to social media analytics, this means that you don't have to track your numbers of each individual social network in a separate space, but all in one place. That allows you to take all necessary steps towards a meaningful analysis at once, without having to manually collect and compare all social media data separately. With all your business data, centralized analytics means combining all your information within one stack and being able to analyse various different data sets within one instance – thus allowing even deeper and increasingly relevant insights.
Combining Different Data Sets
The title says it all. By combining different data sets you aim for more information in one joint file to receive a holistic view. Prior to combining these data sets be sure you understand the structure of both and the logic how you plan to combine.
Cyfe
An all-in-one dashboarding tool that allows you to pull data from popular services like Google and Salesforce using pre-built widgets. With the help of Cyfe, you can monitor different data in one place.
Data Automation
The term "data automation" could be seen as a synonym for data integration with focus on automation. Through this, established processes do not need to be done manually anymore.
Data Centralization
Often used as a synonym for "Centralized Analytics". Have a look at our respective entry!
See how Benefit Cosmetics uses quintly to integrate social media data.
Data Flow
Data Flow describes the individual stages data is going through.
Data Flow Diagram
The Data Flow Diagram (DFD) visualizes the maps out the flow of information. A chart can use different shapes such as rectangles, circles, arrows and short, explanatory text elements to visualize data inputs, outputs, storage points and the routes between each stop. To read more on data flow diagrams, simply follow this link.
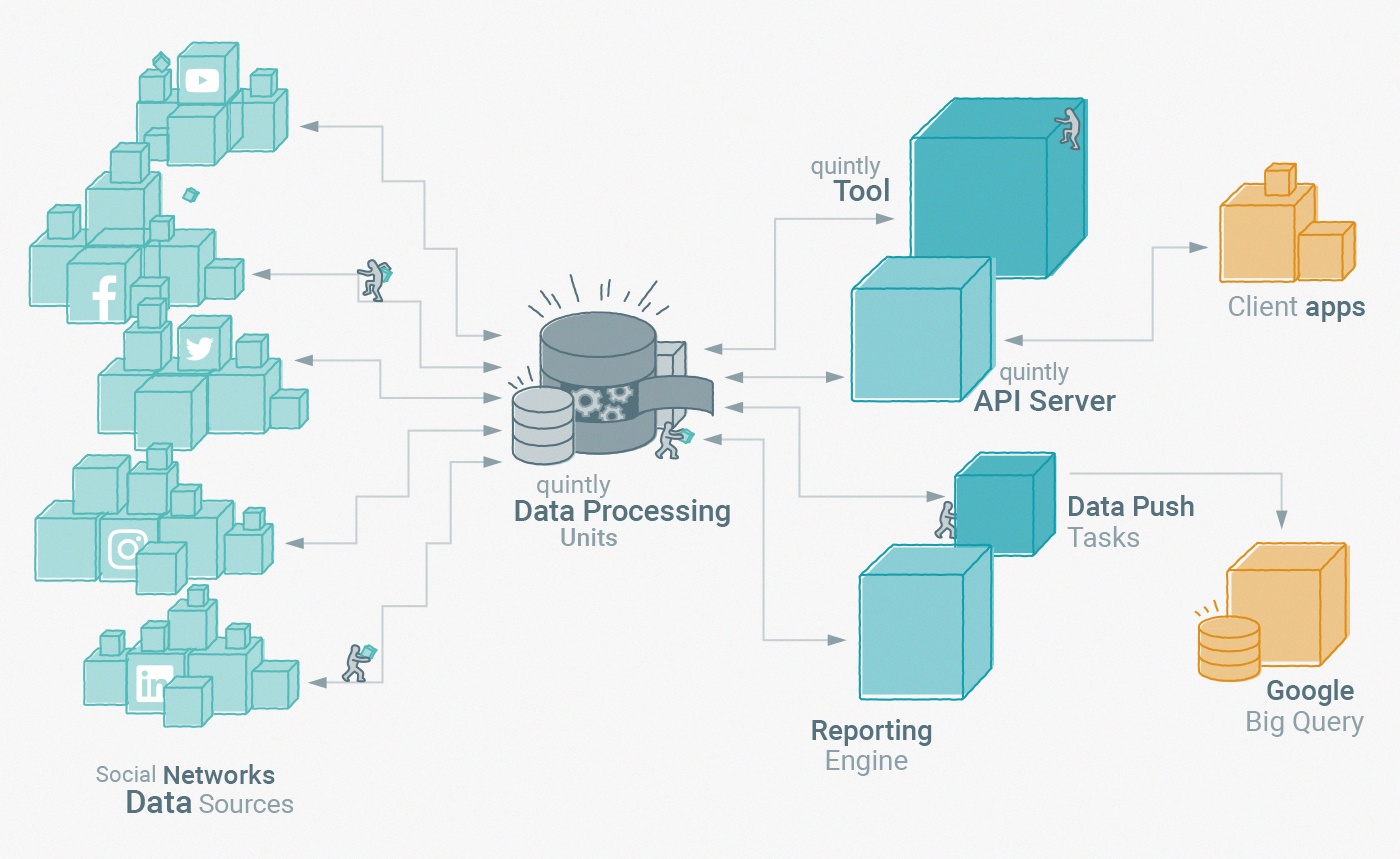
Data Lake
A Data Lake is a storage repository that can hold large quantities of raw data in its native form, including structured, semi-structured and unstructured data. Here, data does not need to be structured until it's needed. The graphic below is an example of a data flow diagram. It visualizes how quintly processes data received from the APIs of social media networks. Further to the right, we show how the data is either pushed into our social media analytics tool or pushed to our clients via our own API.
Data Ownership
This term answers the question: ‘who owns the data?’. It is also the philosophical and legal concept of an entity owning the rights to control access to a particular set or group of data.
Data Push Task
Describing the scheduled process of moving data from one datastore to another, the Data Push Task involves identifying what data should be pushed when, and into which store. For quintly, the task definition involves a QQL query which describes which data to push, a schedule when the data is pushed and the information about the target data warehouse (Google Bigquery table for now),.
Data Silos
A separate database or set of data files that are not part of an organization's enterprise-wide data administration. According to a survey from the American Management Association, 83% of managers think they have (data) silos in their organizations and 97% of those think this could have a negative effect.
Data Visualization
Data Visualization is the process of displaying data/information in graphical charts, figures, bars and other representations.
Data visualization is typically achieved by extracting data, generally in the form of numbers, statistics and overall activity. The data is processed using data visualization software and is displayed on the system's dashboard. It is usually done to assist IT administrators in getting quick, visual and easy-to-understand insights into the performance of the underlying system. Most IT performance monitoring applications use data visualization techniques to provide statistical insight into the performance of the monitored system. (source: webopedia)
Data Warehouse
A Data Warehouse is a central repository in which to store information. It usually contains historical data derived from transaction data, but it can include data from other sources, such as social media.
ETL
ETL stands for Extract, Transform, Load. In computing, it refers to a process used in databases, and especially data warehousing, that blends data from multiple sources. During this process, data is taken (extracted) from a source system then converted (transformed) into a format that can be analyzed. After that, it is stored (loaded) in a data warehouse.
Google BigQuery
Google's cloud-based web service was designed to process large read-only data sets. BigQuery uses a syntax similar to SQL, and there is no need to manage servers because it's serverless. Basically, it's a data warehouse as a service that doesn't require installing any additional database software.
Historic Data
The term "historic data" describes the access to data from the past. Analyzing this data can help you to gain valuable insights into your competitors’ strategies, as well as helping to optimize your own social media strategy. At quintly, it means data from a recent point in time that is not reproducible if missed.
Looker Integration
Looker is a new kind of analytics platform that allows businesses make informed decisions - from anywhere.
Today's most data-driven businesses across many industries use the Looker platform to do more with their data.
You can easily integrate third-party data tools with Looker so that you have all data in one place. A useful case example would be our quintly HQ: Here we take Hubspot data and visualize it on a Looker dashboard, displaying it on a screen in the corner of our marketing team room with the main KPIs of our team. This way, we can react to changes in the present week and monitor if we are on track achieving our goals.
Microsoft Power BI
A cloud-based business analytics service that enables non-technical users to gather, visualize and analyze data. Microsoft Power BI connects to all of your data sources, simplifies your data evaluation and provides the function to share dashboards, interactive reports or embedded visuals.
Redshift
Amazon Redshift is a fully managed data warehouse product that is also part of the larger cloud-computing platform Amazon Web Services (AWS). In order to create a data warehouse you need to launch a set of nodes, called an Amazon Redshift cluster, as the first step. Next, your cluster needs to be provisioned. After that, you can upload your data set and then perform the data analysis queries.
SQL
SQL is an abbreviation for Structured Query Language. SQL is a standardized query language used for managing relational databases and performing various operations on the data in them. Initially created in the 1970s, SQL is regularly used by database administrators, as well as by developers writing data integration scripts and data analysts looking to set up and run analytical queries. (source:webopedia)
Tableau
Tableau is business intelligence (BI) and analytics software. The platform was created to make it easier for you to understand your data and to give you the ability to make data-based decisions. quintly also offers an integration with Tableau. Everyone with it should take a look at this guide: How To integrate quintly with Tableau.
Webhook
A Webhook and an API serve similar purposes but are used in slightly different cases. Simply put, an API does actions when you tell it to, while a Webhook does tasks when a certain criteria or scenario comes into being. More info on webhooks can be found here.
Hopefully, our glossary has helped you to get a better understanding of the process of data integration. If you are planning on integrating social media data, just let us know. Shameless plug: This is something quintly is good at. Our API will help you to get the right data from the right place to receive the most valuable insights.

Join the conversation. Leave us a comment below!