.svg "quintly-logo (1)")

After learning more about the Facebook usage in 2018 by analyzing 105 million posts on 94,000 profiles in the beginning of the year, we decided to dive a little deeper and analyze one specific industry.
For everyone working in media - this one's for you!
So, in this brand new study we are focusing on the analysis of the Facebook performance of media outlets. This includes media, news and broadcasting companies, as well as news and media websites.
More precisely: we analyzed 34 million posts on almost 4,600 profiles that were published between January 1st and December 31st, 2018. The big players in the media sector, along with regional and local newspapers, are represented in this study.
We'll guide you through the following six topics in the following article:
- Profile Data Set on Facebook
- Usage of post types - image, video, status & links
- Interactions with post types
- Post length
- Development of the use of Facebook Reactions
- Publishing on weekdays vs. weekends
We divided the analyzed profiles into six different groups based on the number of their Facebook fans. This way you can apply the results to your own Facebook page more easily. It also helps you to understand the data set.
To give you a first overview, the following chart shows the distribution of the analyzed Facebook pages by size.
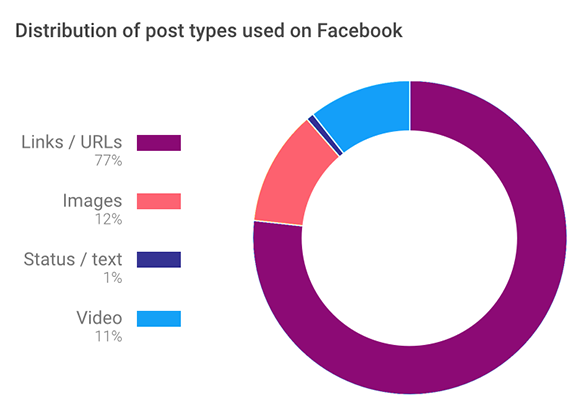
77% of all Facebook posts are link posts
When creating a Facebook post, every user can choose between publishing photos, videos, links or status updates. Of course, every post type gets distributed differently by the algorithm and is perceived differently by users.
Now, the study shows that the most used post type by media outlets are link posts. With a distribution of 77%, this is by far the biggest share. Photo posts follow with 12%, video posts with 11% and status posts with just 1%.
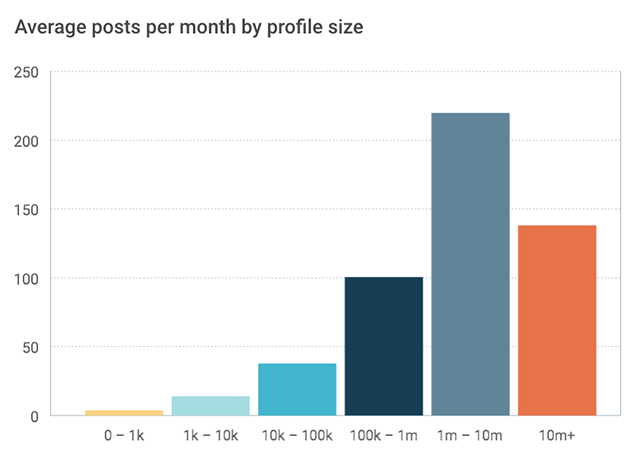
Big profiles tend to post more often
An interesting finding is the rise of the amount of average posts per month according to profile size. The analyzed profiles with up to 100k fans post significantly less than profiles with 100k fans upwards. The highest number of published posts per month are coming from the group with 1 million to 10 million fans.
Video content is rising with the number of Facebook fans
All profile groups work slightly differently and, thus, also use post types in a different manner. As you already know, three-quarters of the 34 million analyzed posts are link posts. Let’s take a more detailed look at how the different groups work.
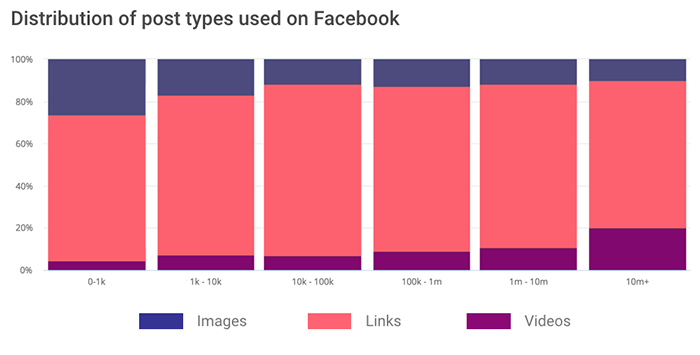
The distribution of videos rising with the number of Facebook fans is clear at first sight. Thus, the largest analyzed group – in which profiles have more than 10 million fans – is publishing way more videos than any other group. In fact, 20% of their posts are videos.
What is interesting is that image posts are dropping significantly the higher the number of Facebook fans, particularly within the three smaller groups. Whereas images make up 26% of the posts made by groups with 0-1k fans, they represent only 12% within groups with 10k-100k fans.
Profiles with 10m+ fans have the smallest distribution of image posts with just 10%.
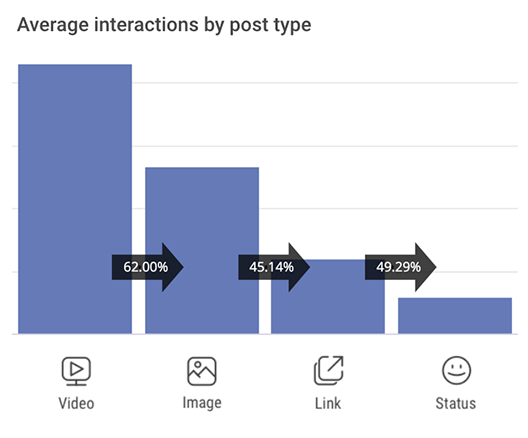
Videos receive far more interactions than link posts
Let’s take a look at the interactions related to post types. In case you need a refresher, interactions are essentially the sum of likes + comments + shares. So, which format leads to the highest engagement?
The study shows that video posts get by far the highest interactions. Images come next but still receive 38% fewer interactions than videos.
Only then come link posts. Even though they are the most frequently used post type, they receive 72% fewer interactions than videos. That being said, status updates get the lowest interactions.
In the end, it’s all about your strategy, about what you want to achieve. Do you simply use Facebook to drive traffic to your website? Then it might still make sense to publish link posts. You should be aware though, that this decision is followed by a lower reach and fewer interactions.
If you want users to engage more with your content, you maybe should rethink your strategy. Or try both!
This is why social media analytics is so important. If you analyze your performance thoroughly, you are able to make decisions based on data that will lead you to your strategic goal in the end.
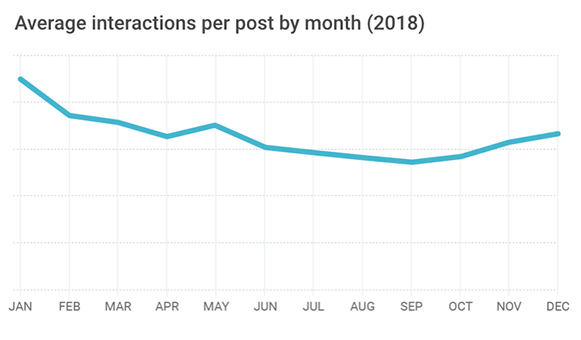
Average interactions are on the rise again
After the number of average interactions dropped continuously from the beginning of 2018 – with just one exception in May (was it the Royal Wedding?) – we now have good news for media companies. There has been an upwards trend for average interactions since September 2018! Happy posting!
46% of all posts are longer than 50 characters
Let’s get to the next part of our study: the length of Facebook posts. To paint a better picture, we divided the character lengths into five groups, going from zero to 300+ characters used.
With a distribution of 46%, posts with a length of 50-150 characters make up almost half of the share of our data set. Posts with 150-300 characters have the second-biggest share with 24%.
This means that either very long, very short or posts with no text at all make up the smallest part of the distribution, with just 30%.
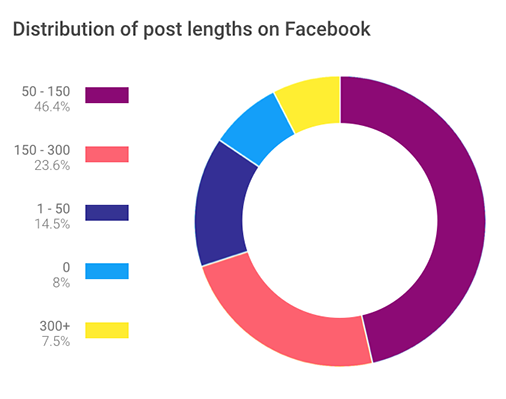
All in all, the study shows that 75% of all posts that get published by media companies are longer than 50 characters. But do these posts also get the highest engagement?
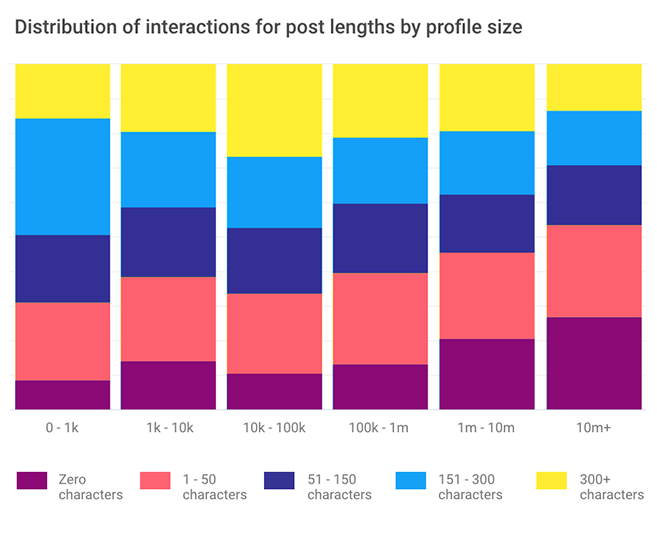
Our study shows that, for example, posts with no caption or 0-50 characters get engagement from 33% to 54% throughout the analyzed post length groups.
But of course, these results are very much dependent on the individual profile. That’s why we split our results into groups according to profile size. This way, you are able to compare your own profile to the average behavior of a specific profile group, compare it to your own posting strategy and draw your own conclusions.
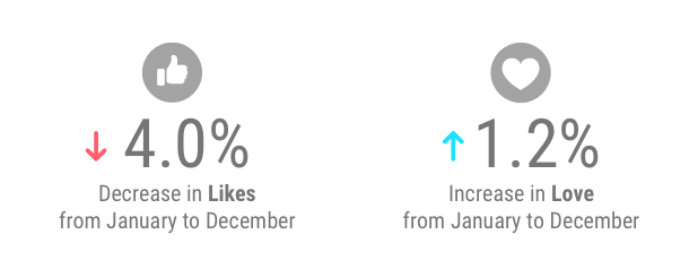
Usage of “New Reactions” is rising
In 2016, Facebook launched the Reactions feature. Since then, users are not only able to “Like” a picture, but can also express their feelings through different reactions, such as “Haha” and “Love”. Users didn’t use reactions as much at the beginning and, seemingly, first had to get used to the new feature.
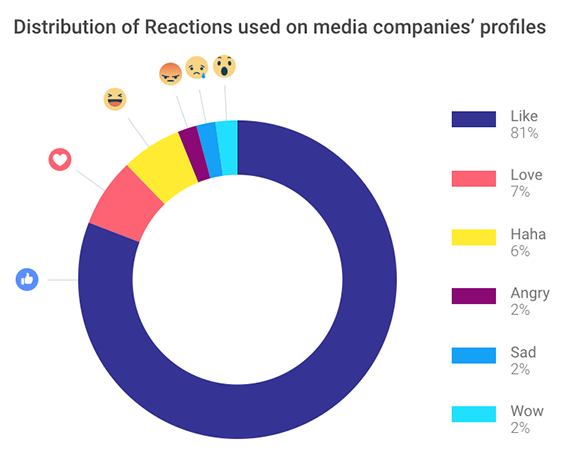
Now, the usage of Facebook Reactions is steadily growing. Analyzing the profiles of 4,584 profiles from media outlets during a whole year, we can see how the usage of Facebook Reactions is developing. The good old “Like” is slowly losing its popularity while the “Love” and “Haha” reactions are increasing.
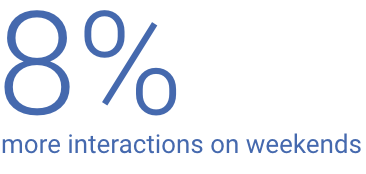
Slightly higher interactions on weekend posts
Timing on social media is crucial. That’s why we decided to compare weekday and weekend posts and found out that 24% of all posts are published on weekends. In comparison, this shows a somewhat higher posting trend on weekdays.
Yet, interactions are higher on weekends. Our study shows that posts that are published by media outlets on weekends receive 8% more engagement than weekday posts.
 We hope you find this study helpful and can extract some information for yourself.
Please note that the results of our study are averages of our specific data set (even if it consisted of 34 million posts). Simply adapting our findings will not directly influence your profile’s performance in a positive way.
Instead, see it as an inspiration for your own Facebook strategy. Because every Facebook profile works in its own way, it’s very important to continuously pay attention to your performance.
Questions? Leave us a comment below or find us on LinkedIn, Instagram, Facebook, Twitter.
Recommended reading:
Facebook Trends 2023: The Latest Insights
10 Facts for More Success in Stationary Retail Using Social Media
How to analyze Instagram Stories
Best time to post on Instagram
How does Instagram Insights work?
Instagram Analytics - Get the most out of Instagram!
7 ways to get more Facebook video shares

Join the conversation. Leave us a comment below!