.svg "quintly-logo (1)")
Especially in big companies, data visualization plays an increasingly important role. In order to ensure the best possible distribution of information within teams, data silos need to be broken up. Through this approach, employees in the office will see the data relevant to them. This article will discuss how marketers and data analysts can visualize data in the best possible way.
As we see ourselves as specialists in the social media analytics market, we were looking for a strong partner in this very field. That’s why we are incredibly glad to work with Brandwatch: more precisely, with their Vizia team. Vizia is a simple-to-use data visualization tool that allows you to easily create engaging displays that can be distributed across the organization to screens or via email.
An integration of Brandwatch Vizia and quintly - the idea behind it!
We at quintly don’t offer any specialized big screen solution as we want to focus on delivering the best analytics tool to the market. That’s why you can see quintly and Vizia as two layers that perfectly go together.
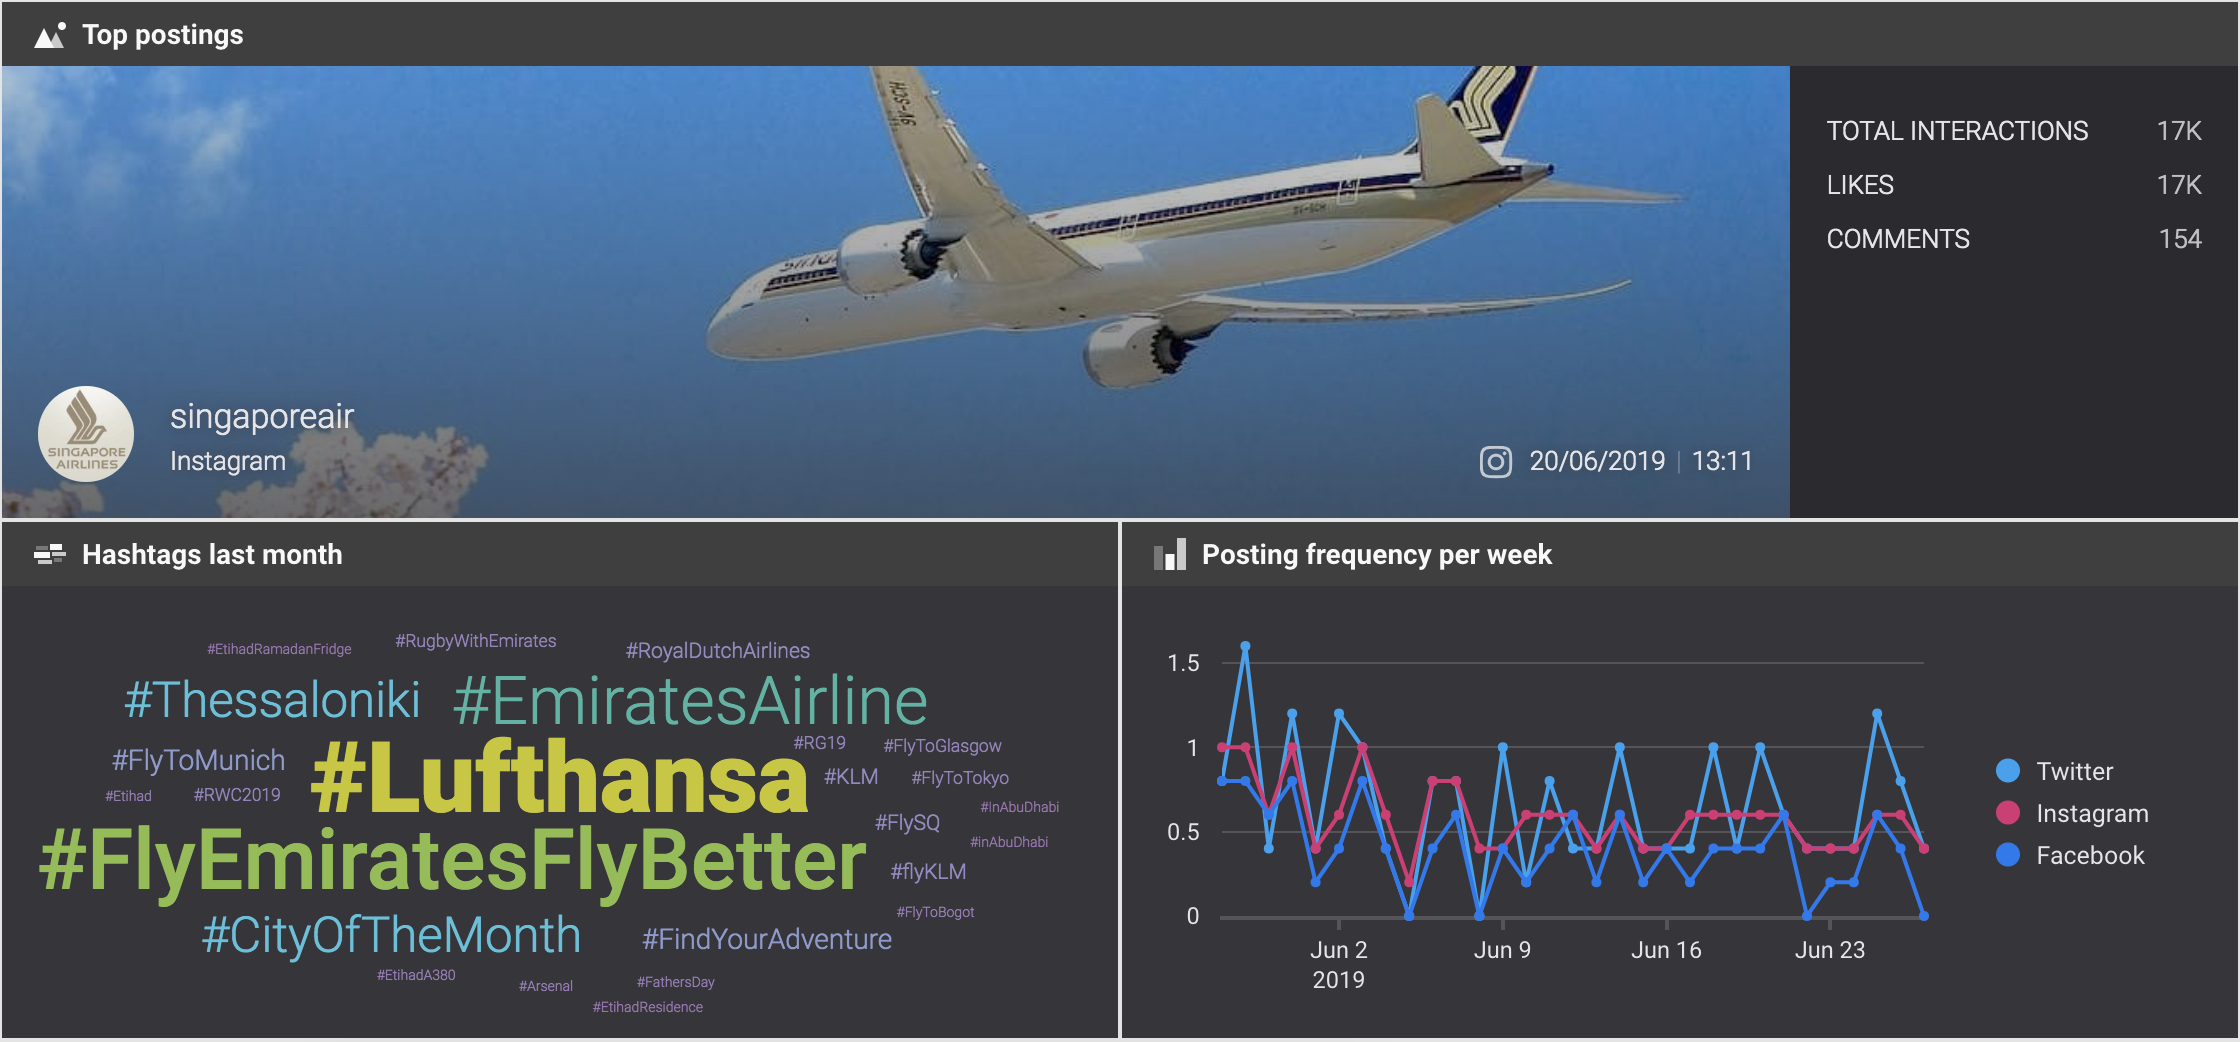
“We are really excited to partner with Brandwatch Vizia. Both products layer nicely on top of each other, with quintly providing the data sets around social media profiles and Brandwatch Vizia visualizing those data sets alongside other data points on big screens and command center solutions. This enables our customers to make information around their social media activities easily digestible within their organizations.”
 — Frederik Born, CTO and co-founder at quintly
Where does this idea come from?
Frankly speaking, it was a client who approached Brandwatch and us requesting quintly data in their Vizia dashboard. While helping our client to integrate the data he needed, we thought, “This is cool and certainly helpful for more companies. Why don’t we make this default?”
So we did!
After a couple of calls with the Brandwatch team, fruitful meetings in person and some lines of code, the integration was set and our client happy. Our mission now? Make more people happy with big screen solutions for social media data.
Behind the scenes: the quintly integration was built using the Brandwatch developer framework.
Is this integration useful for me?
We would bet it will be!
Almost every company that considers itself advanced in social media will have a use for visualizing data either within the office or at an event. With the company getting bigger and information gaps growing, this is getting even more important.
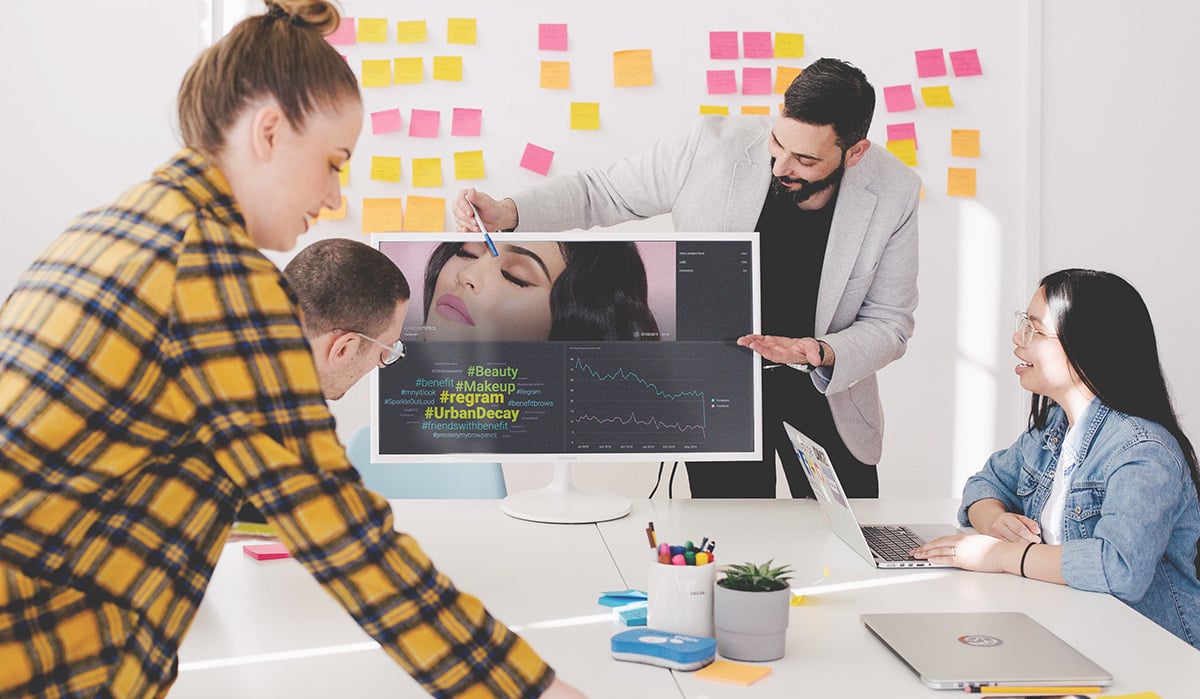
Our client, RTL Media Group from Germany, is a media company with over 5,000 people. For them, it became essential to keep everybody on the same page establishing a data culture within the corporation. Now, these Vizia command centres are displayed on screens in their “Marketing Café”, informing people passing by on high level KPIs.
“As data culture has become increasingly important within our organization, making the right data accessible for the individual employee has become essential. Here, Brandwatch Vizia allows us to bring important data points, such as those delivered by quintly, together and display easy-to-digest live dashboards with social media data in our Marketing Café. This is a great way to show important KPIs to all relevant people on a daily basis."
 — Dagmar Wurzer, Digital Marketing Manager at RTL Media Group
How exactly does it work?
Our CTO, Frederik, and the technical team at Brandwatch spent a couple of days integrating the two solutions as natively as possible, so the process is extremely straight-forward.
As a quintly client, you just contact our team via mail and we will introduce you to our partners at Brandwatch and align a demo. Shortly after, you can see Vizia in action and consider whether adding quintly data to your live reports would benefit you.
As a Vizia client, it’s even easier! While setting up your Vizia decks, you can just choose quintly components and add them to your dashboard, without being a quintly client!
Here, you just select the preferred industry you want to look at and select the (public) data you want to display. If you would like to have even deeper insights into your own channels (for which you need to be a quintly client), you simply head over to this page and speak to one of our client advisors.
Now, over to you!
Integrating multiple data points will become one of the biggest challenges in the near present, using BI tools like Tableau and Looker in order to analyze various different data sets in detail. Here, another client of ours, Benefit Cosmetics, did great work using quintly data in Tableau to really dig deep in data.
Your data teams need to decide which data is presented in which format.
With integrations like this you are able to combine information in one dashboard. Just imagine how powerful it could be to display social media data along with Google Analytics KPIs and other business critical metrics on a big screen in your office.
By integrating the right data points and displaying them at the right place, information can be allocated in the best possible way so that your teams know exactly what success looks like.

Join the conversation. Leave us a comment below!