How do you know whether your LinkedIn company page is performing well? Dig into LinkedIn analytics. You’ll discover what improvements your LinkedIn company page needs.
Is anyone looking at your content there? So many questions! Fortunately, Agorapulse’s LinkedIn reports can help answer them.
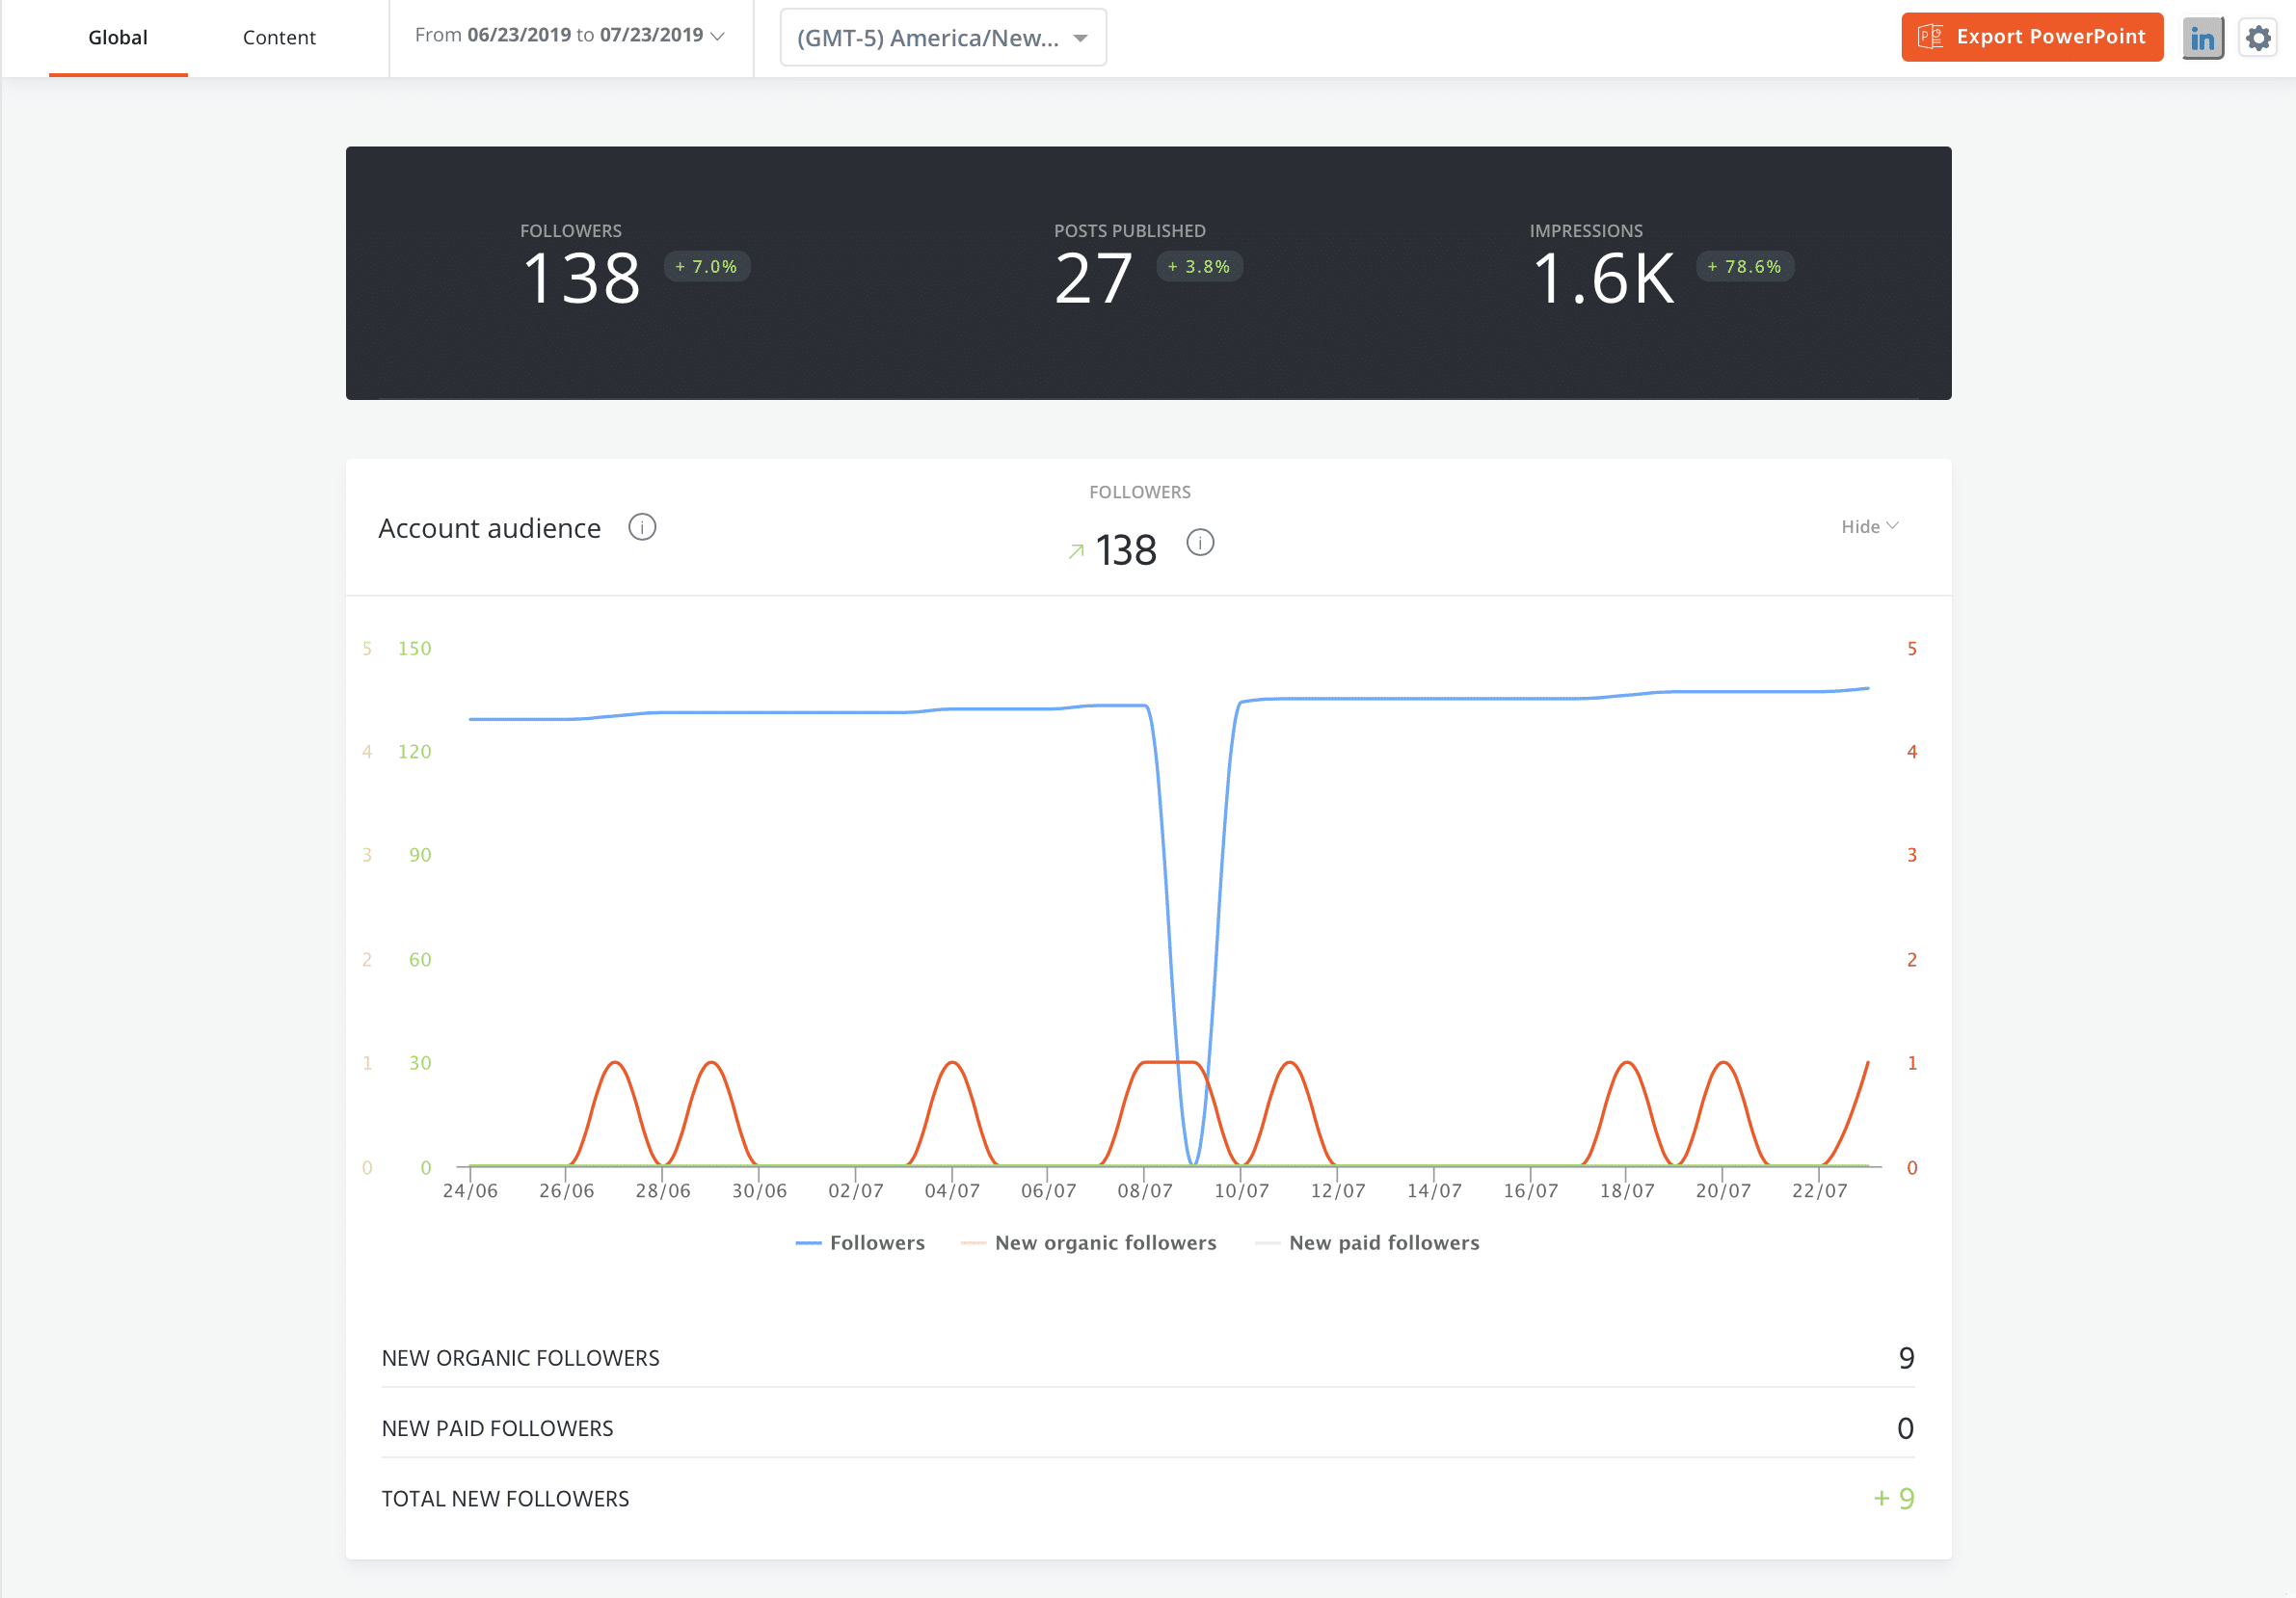
1. Audience Growth
Is your content attracting and retaining followers?
Follower growth is somewhat of a vanity metric, but you should not completely ignore your follower numbers.
In regards to LinkedIn analytics, follower growth (or lack thereof or complete loss) can be a good indicator of how your LinkedIn Company Page is performing in general.
Let’s break this down: An influx or steady increase in followers usually means that people are finding your account, liking the content you share, and choosing to follow you.
A big influx of activity can also mean that you’ve had a mention by a bigger brand and that you’re getting an influx of traffic.
To maximize your brand impact by using this metric: Pay attention to big influxes or losses of followers. Sometimes, factors outside of your control affect gains or losses (big mention vs. the social network flushing inactive accounts).
How to see LinkedIn analytics: Agorapulse’s LinkedIn reports give you a great overview of your current following and how many followers you’ve gained or lost over specific date ranges.
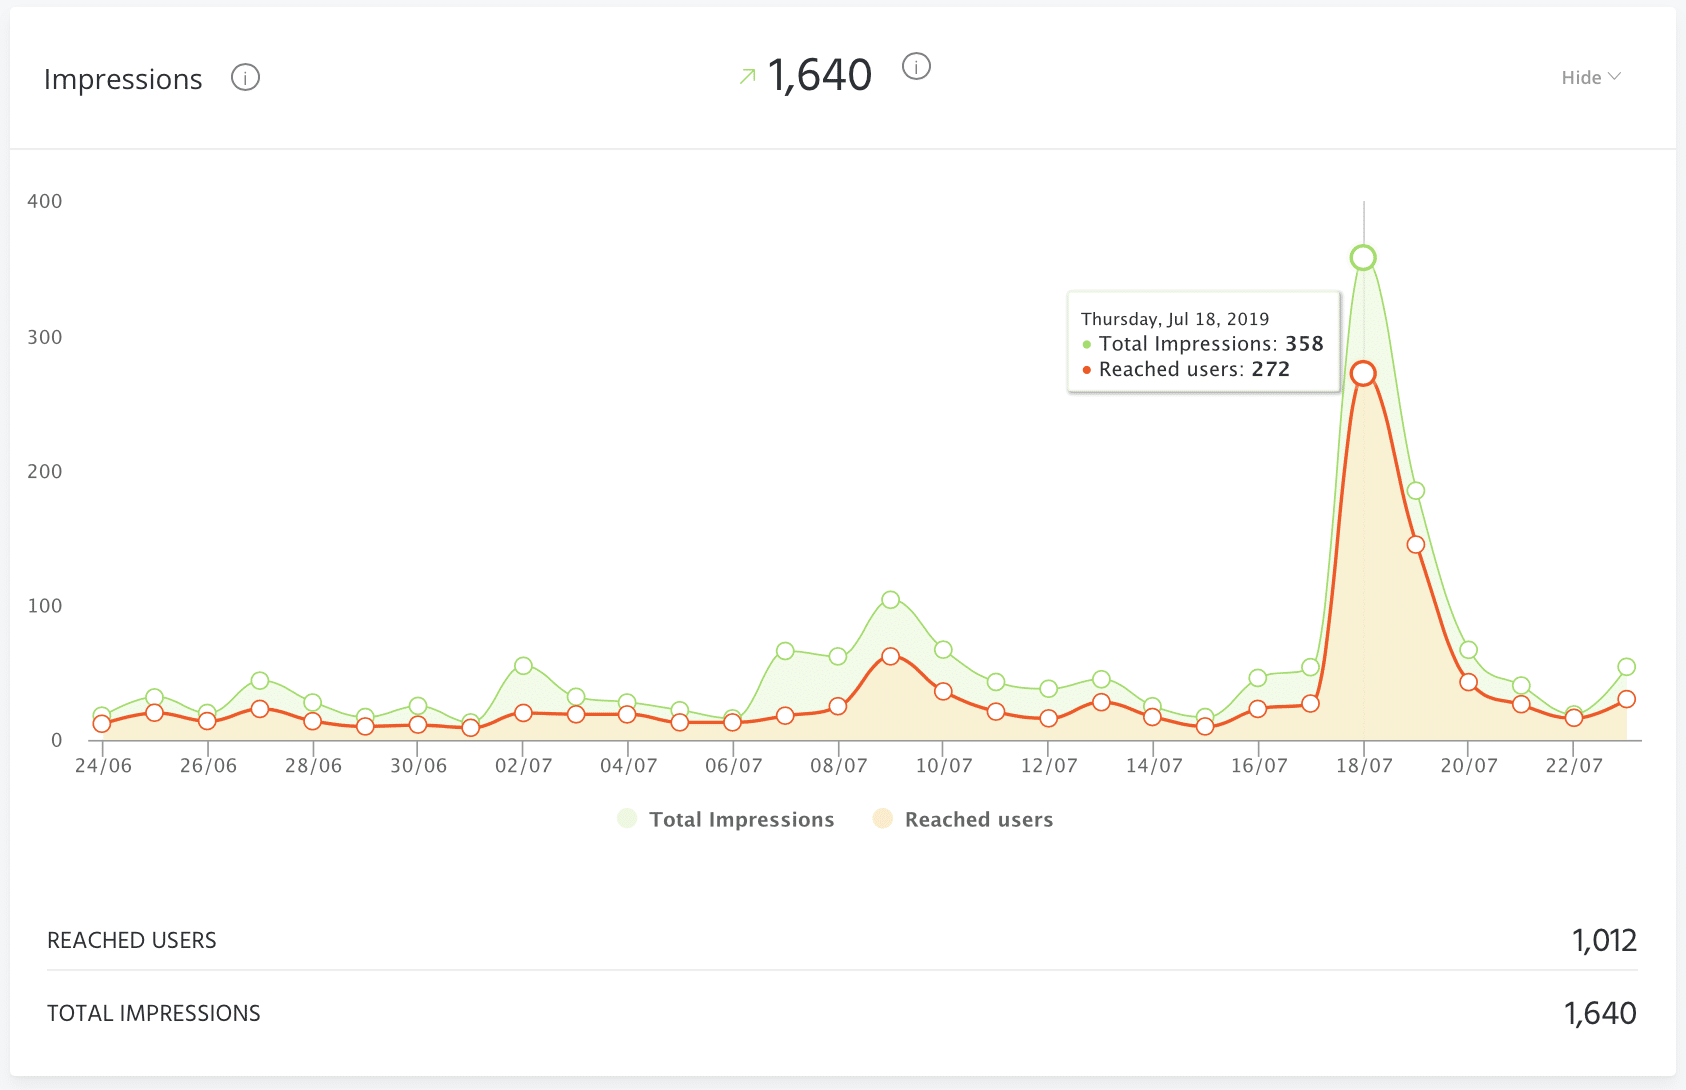
2. Reach and Impressions
How far is your content going?
First, let’s discuss the difference between reach and impressions.
Reach refers to the unique number of people that saw your piece of content.
Impressions refer to the number of times the post was shown to LinkedIn members (one person or account can see your post more than once).
Related Post: LinkedIn 101
Here’s why you should keep track of these numbers: Reach and Impression let you know how many accounts have seen your LinkedIn updates.
They allow you to calculate your engagement rate (how many of the people who saw your post actually took an action on it). Higher reach and impression numbers mean your content has legs!
To maximize your brand impact by using this metric: Agorapulse’s LinkedIn Reports let you look at time periods when there are peaks in impressions and figure out what content pieces resonate with your audience.
That will help you come up with new content ideas based on what is working.
How to see LinkedIn analytics: In the chart below, you’ll notice a big peak towards the end of the month.
The next step is to click on the “content” tab and see what was posted on the date of the big peak and repeat the topic of content format for sustained impressions.
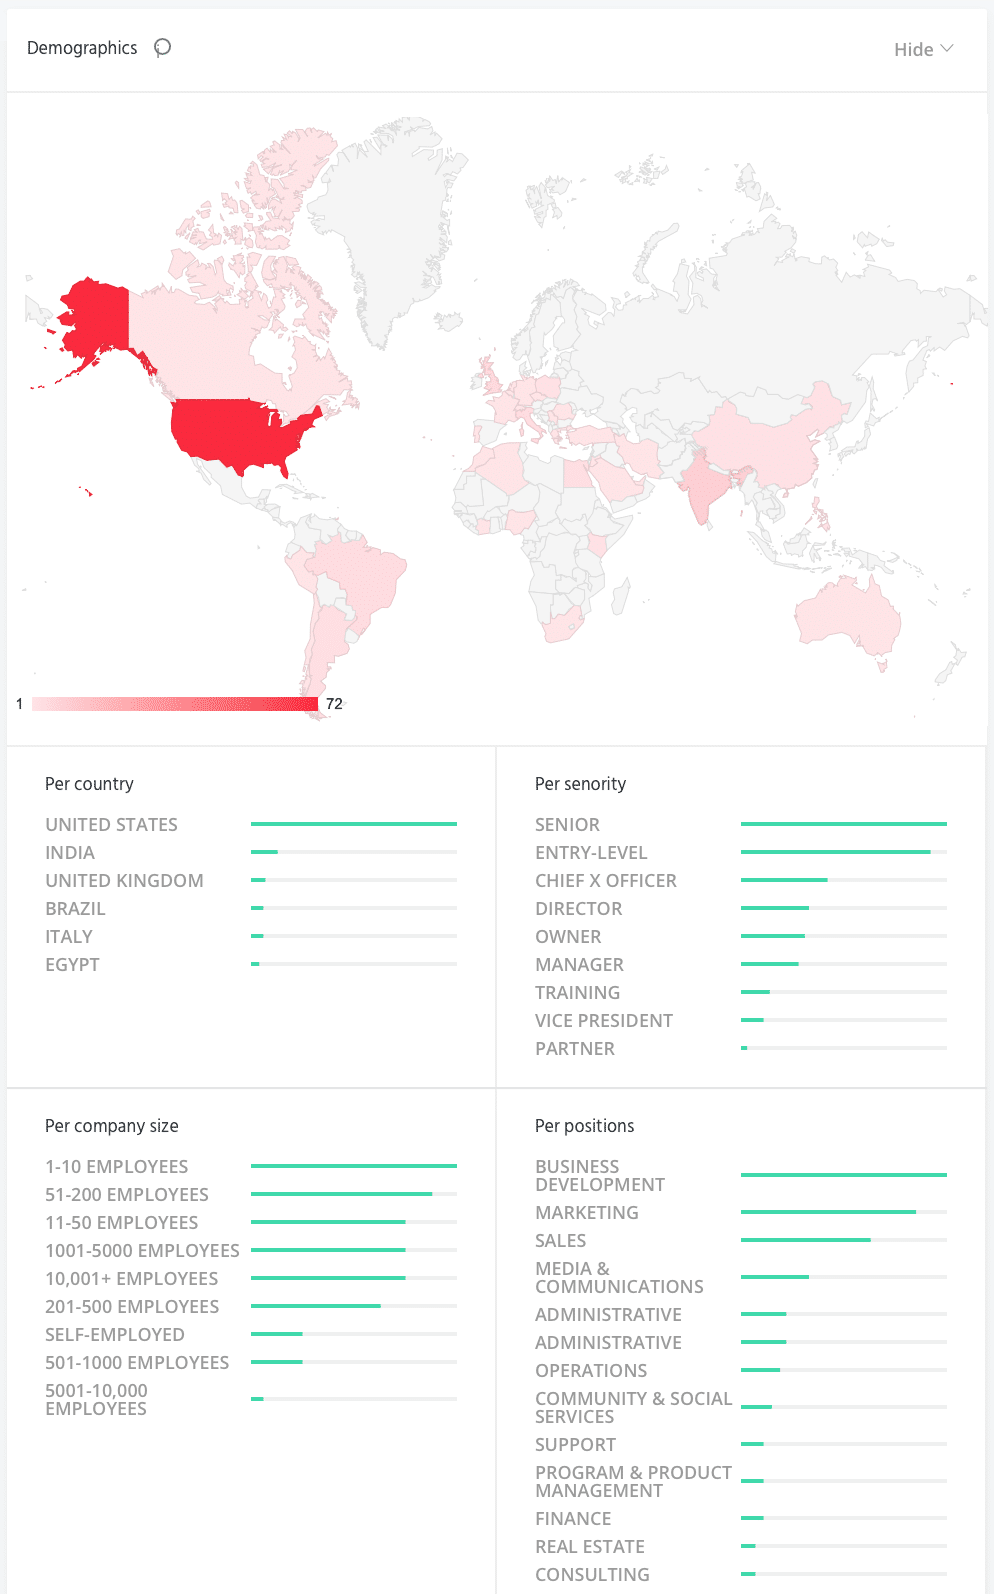
3. Demographics
Do you know your audience well?
One KPI that is important in knowing your audience is their demographics. In Agorapluse LinkedIn reports, you’ll see a breakdown of where your followers are located, their seniority, company size, and positions.
To maximize your brand impact by using this metric: The more you know about your audience, the more you can cater your posts to pique their interests.
How to see LinkedIn analytics: Taking a look at demographics should also help you know whether you’re growing the correct audience. For example, is your brand based (and trying to reach people locally) in the U.S. but the report shows most of your audience is in Europe?
This lets you know an adjustment to your posting schedule or content needs to be made.
Content-Specific KPIs for Your LinkedIn Page
Now that we’ve covered the general page KPIs, let’s move on to your break down your individual LinkedIn post metrics!
In this next section, we’ll explore content specific KPIs these reports help you find.
4. Post Engagement
Likes and comments
One of the KPIs I’m currently keeping a close eye at the moment is post engagement. Given the current state of social media marketing, tending to the audience you already have is the best way to grow and reach new people.
If the algorithm sees that your audience engages with your posts, it has no choice but to show your content to a larger portion of your audience and some new people as well.
Engagement includes likes, comments, clicks, shares, and messages. A big influx of likes and comments can mean you’ve hit content gold.
As mentioned earlier, pay attention to posts that get a lot of engagement so you know what kind of content your audience is into.
To maximize the impact of your brand by using this metric: Agorapulse’s LinkedIn reports allow you to respond to comments right from the dashboard, making it very easy to stay on top of interacting and building relationships with people engaging with your content.
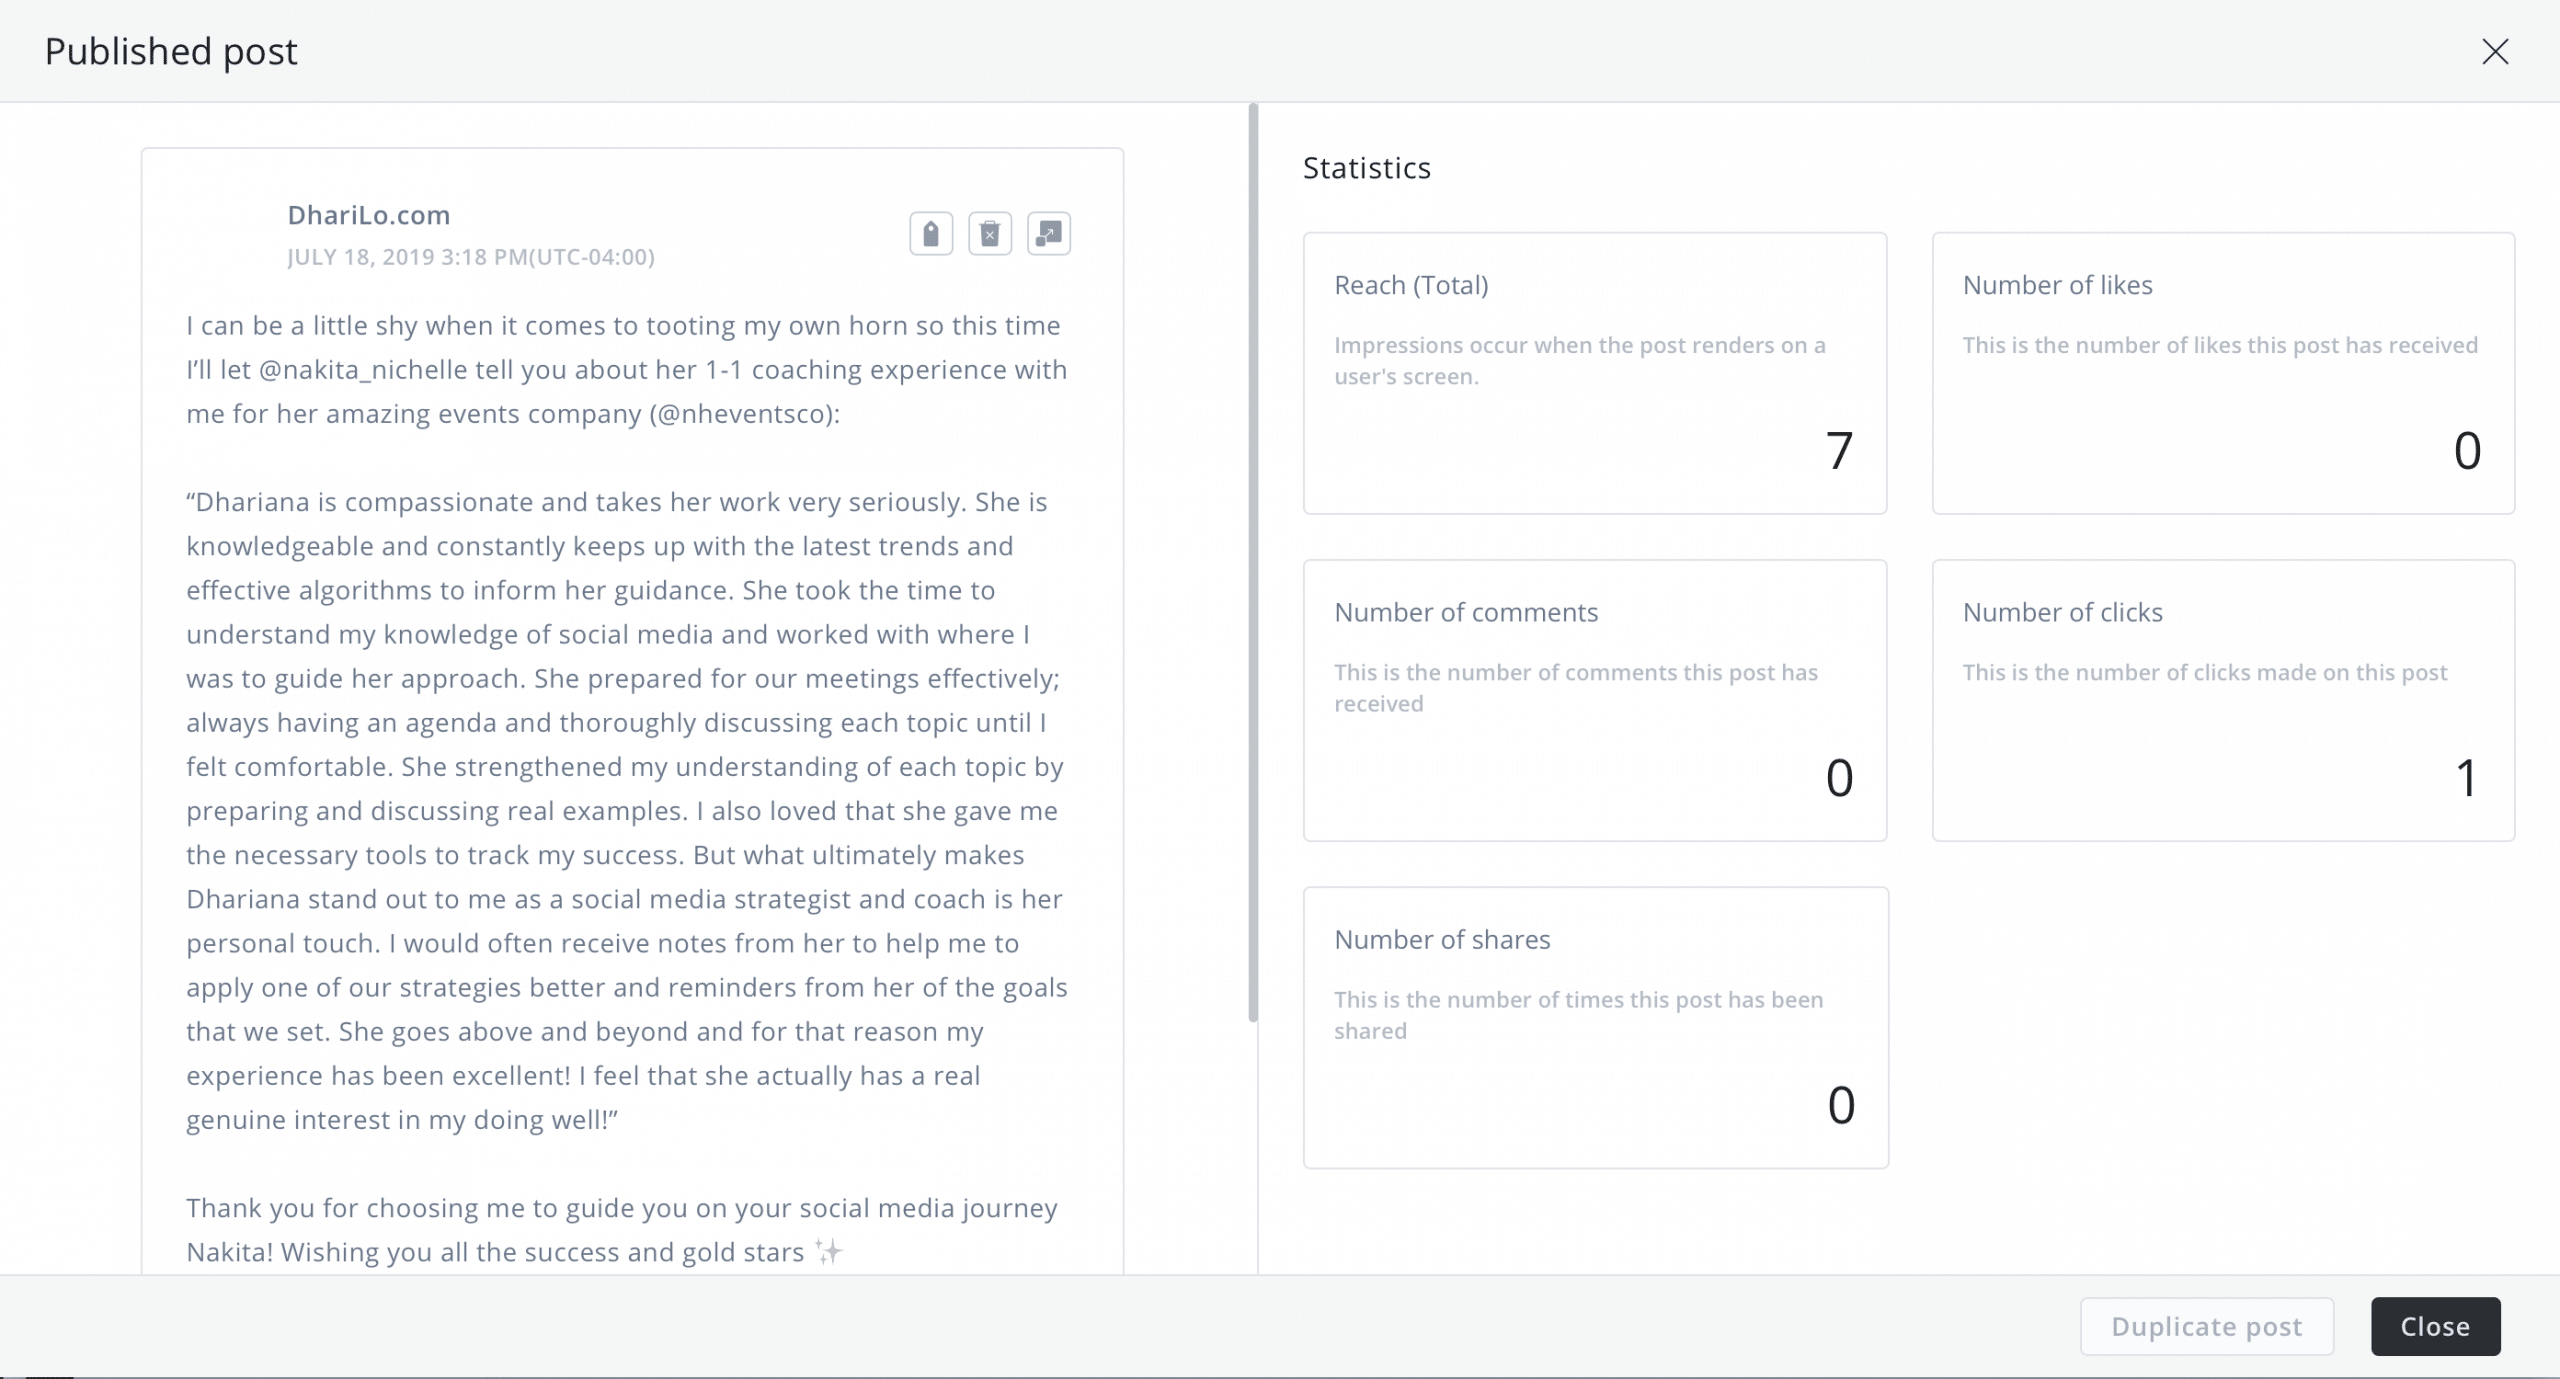
5. Clicks
Are your posts converting?
Sometimes, clicks and web traffic can be a little bit overlooked in social media analytics. I briefly mentioned clicks in the previous point because ultimately clicks and traffic are what you want from your social media audience.
If your LinkedIn followers are willing to click away from LinkedIn to your landing page or website, you know they must really be into your brand or business. The Agorapulse LinkedIn report will show you any clicks on your content, company name, or logo.
To maximize the impact of your brand by using this metric: Pay attention to the posts getting the most clicks. Test the topics these particular posts covered or the content type (video vs. image vs. link) to see what your audience responds the most to. Then rinse and repeat!
Sign up now for a FREE demo.